

- Macro backdrop remains tepid for commodities as tight monetary conditions continue to dampen demand
- Oil prices rise on geopolitical tensions and trade route disruptions in the Middle East
- Despite trading at multi-year lows vs equities, we recommend staying cautious on hard commodities until more definitive signs of global economic recovery emerge
- Thematic focus areas such as the energy transition, global warming, and decarbonisation will facilitate a shift in commodity demand
Related insights_tr

Waiting for rate cuts. Moving into 2Q24, it is clear that many central banks, including the US Federal Reserve, have ceased their hiking endeavours. However, no central bank has yet to implement any rate cuts, which means rates are still in restrictive territory and weighing on commodity demand. This challenging state of affairs could persist as hopes of early rate cuts fade on the back of an exceptionally resilient US economy and labour market.
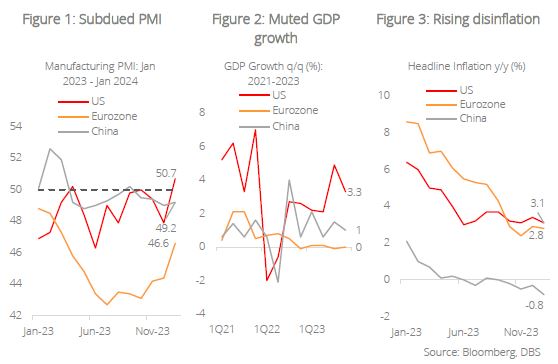
The global economic engine is chugging but sluggish. Outside of the US however, economic momentum appears to have slowed markedly; Jan 2024 PMI data showcased marginal improvements from Dec 2023 but lingered within anaemic territory for both China and the Eurozone. GDP growth painted a similar picture, with the US posting robust growth rates of 4.9% and 3.3% in 3Q23 and 4Q23 respectively. In contrast, the Eurozone narrowly avoided a technical recession, and China saw modest expansion during the same period. Turning to inflation, while headlines have touted a resurgence in US core inflation, the more pertinent headline inflation measure for commodities (which encompasses energy and food prices), experienced a decline from 3.4% y/y in Dec 2023 to 3.1% y/y in Jan 2024. Eurozone inflation also continued its marginal descent (+2.8% y/y in Jan 2024 vs +2.9% y/y in Dec 2023), while China saw an escalation in deflation, with prices dropping by -0.8% y/y in Jan 2024 compared to -0.3% in Dec 2023.
Overall, indicators suggest a trend towards sluggish and moderating economic activity, with scant visibility regarding potential rate cuts and other significant macroeconomic catalysts.
Energy
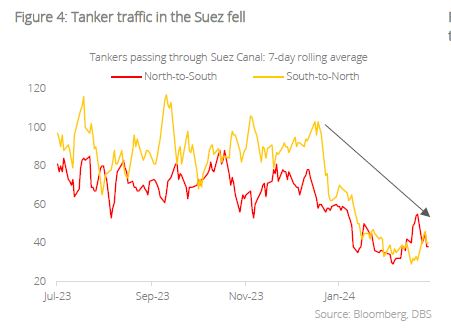
Flared tensions in the Middle East. The Israel-Hamas conflict continues to impact commodities through supply chain disruption risk. Houthi militants, acting as proxies for Iran and supporters of Hamas, have been conducting attacks on ships in the Red Sea from Nov 2023 to Jan 2024. In November, they seized the Galaxy Leader, a vehicle carrier, and brought it to a Yemeni port. In late January, they targeted and damaged the Marlin Luanda, an oil tanker operated by commodities trader Trafigura. These incidents have impacted global supply chains, not only through the seized and damaged ships but also through the avoidance of trade routes passing through the Red Sea.
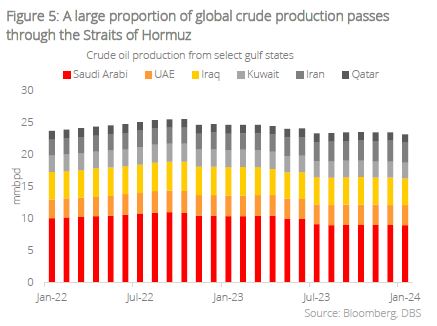
Trade disruption provides upside for oil. The most pronounced impact of these disruptions has been observed in global oil prices, which rose by c.8% from mid-Nov 2023 to end-Feb this year. This increase is unsurprising given that approximately a quarter of global crude oil production and a third of its related trade passes through the Straits of Hormuz. As such, any escalation of conflict in the region is expected to result in a spike in commodity prices, especially crude oil, albeit on a short-term basis as we have witnessed on multiple occasions in 2023.
Industrial Metals
(Temporarily) stalling EV demand. In 2024, a decline in demand and sales for EVs is anticipated. US-based EV giant Tesla reported 4Q23 revenue of USD25.2b, falling short of analyst estimates of USD25.6b and marking a meagre 3% y/y increase, its slowest growth pace in over three years. Additionally, the company issued warnings of “notably lower” sales growth for the upcoming year. Similarly, BYD, the world’s largest EV maker by sales, projected a much lower growth in net profit for 2023 – ranging between 74.5% and 86.5%, significantly below the remarkable 446% surge recorded in 2022. This overall trend indicates a stalling momentum in global EV adoption, at least in the short term.
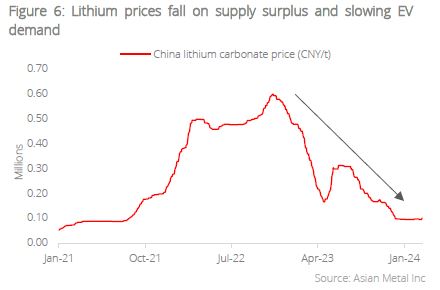
Lithium prices currently in lull. This slowdown has had a tangible impact on commodity producers and prices, particularly in the lithium market. Albemarle, the world’s largest producer of lithium, a key material in EV batteries, announced job cuts and reduced capital spending in response to slowing EV growth and declining EV selling prices. Reports indicate that these job cuts may affect around 4% of its workforce. Prices of lithium carbonate, a refined product used in batteries, have plummeted to nearly one-sixth of their peak levels observed in late 2022. Although long-term expectations suggest a growth in lithium prices due to a fundamental demand-supply gap, market dynamics do not appear to favour the battery metal for the remainder of 2024. The current lull in lithium prices reflects the non-linear progression expected in the EV transition.
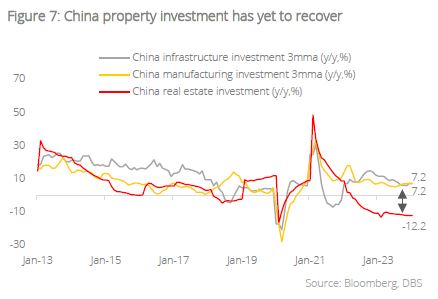
China real estate woes continue. Construction activity in China remains significantly below the expected level, with no clear solution in sight for the debt issues plaguing property developers. However, investment in infrastructure and manufacturing is expected to provide some stability to metal demand. Overall, we do bit anticipate a significant change in industrial metal demand from China over the next two quarters, particularly for high-use metals like copper and aluminium. YTD, aluminium prices have fallen by 6.5%, while copper has seen a slight decrease of 0.8% as of 1 Mar 2024. Copper has performed relatively better than aluminium due to supply side factors, notably the temporary halt in operations at one of the metal’s largest recent greenfield developments, the Cobre mine in Panama.
Agricultural commodities
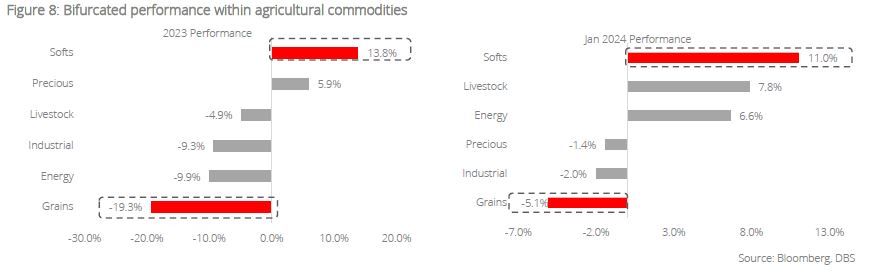
Softs outperformed while Grains lagged in 2023. Agricultural commodities have had some of the most bifurcated performance in 2023 with Grains recording the worst performance within the commodities complex (-19.3%) and Softs recording the best (+13.8%). 2024 has seen a continuation of this trend as Grains shed a further 5.1% in Jan 2024 while Softs gained 11.0% during the same period.
Grains weighed down by strong supply. The poor performance of agricultural commodities can be largely attributed to robust supplies. US corn production is expected to reach 389.8 million metric tonnes (mmt) for marketing year (MY) 2023-24, marking a significant y/y increase of 38.6mmt and setting a new record. Similarly, soybean production in Brazil and Argentina, the largest and third-largest global producers respectively, is projected to yield strong outputs for the 2023-24 season. In Dec 2023, the USDA raised its estimates for Brazil’s soybean export projection MY 2023-24 to 103.0 million mmt, reaching an all-time high. Although Russia’s withdrawal from the Black Sea Grain Initiative could pose upside risks to global food prices, particularly for wheat, the impact on prices has been muted so far. This is due to Ukraine’s ability to continue exporting grain and oilseeds through alternative means such as barge, road, and rail across the country’s western borders.
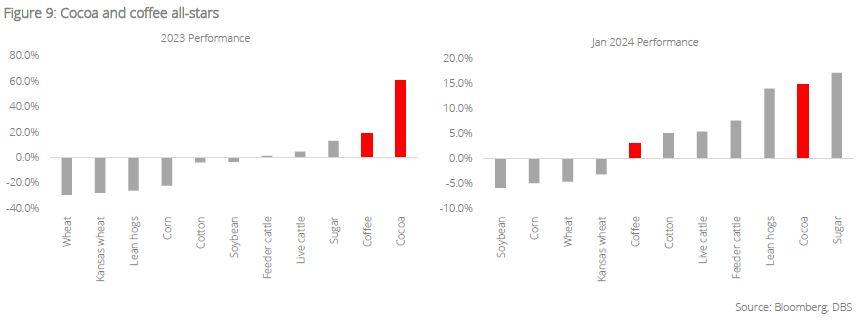
Cocoa and coffee were top performers among Softs. The main driver of Softs’ outperformance was cocoa, which gained 60.8% in 2023, and a further 14.9% in Jan 2024. This significant increase in prices reflects the ongoing deficit in the global cocoa market, which is expected to persist for the third consecutive year in 2024. The deficit is due to a combination of resilient demand for cocoa and cocoa products, and supply shocks from El Nino, fertiliser shortages, and outbreak of swollen-shoot disease in Ivory Coast and Ghana, which collectively account for two-thirds of global production. Coffee was also a strong contributor to the Softs subsegment, registering gains of +20% for 2023 and a further +3.1% in Jan 2024. The outperformance for coffee was similarly driven by stable demand and a reduction in supply and stocks due to adverse weather. It is also worth noting that coffee prices were likely a beneficiary of the aforementioned Red Sea disruption as coffee is typically shipped in containers (instead of bulk carriers), and more container ships were diverted from the Suez Canal than bulk carriers.
Conclusion
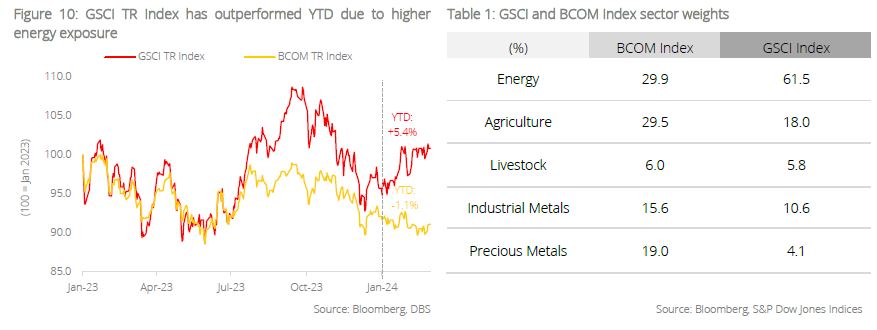
Commodities continue to face headwinds from the tight monetary environment, and this is reflected in a myriad of macroeconomic datapoints, from PMI to GDP growth and inflation. While the performance of broad commodities has picked up marginally this year, majority of the outperformance could be attributed to idiosyncratic factors (e.g. geopolitical conflict, weather conditions, mine closures etc.) and cyclical factors rather than structural ones. Energy, in particular, was a beneficiary of rising tensions in the Middle East. As a result, we can see a clear outperformance of the S&P GSCI total return (GSCI TR) index vis-à-vis the Bloomberg Commodities total return (BCOM TR) index since the former has significantly higher allocation to Energy. All in all, we continue to stay cautious on this asset class, awaiting clearer signs of easing monetary conditions and a firmer global economic recovery. In the longer term, we believe that thematic focus areas such as the energy transition, global warming, and de-carbonisation are still at play and will facilitate a shift in commodity demand.
Topic
The information published by DBS Bank Ltd. (company registration no.: 196800306E) (“DBS”) is for information only. It is based on information or opinions obtained from sources believed to be reliable (but which have not been independently verified by DBS, its related companies and affiliates (“DBS Group”)) and to the maximum extent permitted by law, DBS Group does not make any representation or warranty (express or implied) as to its accuracy, completeness, timeliness or correctness for any particular purpose. Opinions and estimates are subject to change without notice. The publication and distribution of the information does not constitute nor does it imply any form of endorsement by DBS Group of any person, entity, services or products described or appearing in the information. Any past performance, projection, forecast or simulation of results is not necessarily indicative of the future or likely performance of any investment or securities. Foreign exchange transactions involve risks. You should note that fluctuations in foreign exchange rates may result in losses. You may wish to seek your own independent financial, tax, or legal advice or make such independent investigations as you consider necessary or appropriate.
The information published is not and does not constitute or form part of any offer, recommendation, invitation or solicitation to subscribe to or to enter into any transaction; nor is it calculated to invite, nor does it permit the making of offers to the public to subscribe to or enter into any transaction in any jurisdiction or country in which such offer, recommendation, invitation or solicitation is not authorised or to any person to whom it is unlawful to make such offer, recommendation, invitation or solicitation or where such offer, recommendation, invitation or solicitation would be contrary to law or regulation or which would subject DBS Group to any registration requirement within such jurisdiction or country, and should not be viewed as such. Without prejudice to the generality of the foregoing, the information, services or products described or appearing in the information are not specifically intended for or specifically targeted at the public in any specific jurisdiction.
The information is the property of DBS and is protected by applicable intellectual property laws. No reproduction, transmission, sale, distribution, publication, broadcast, circulation, modification, dissemination, or commercial exploitation such information in any manner (including electronic, print or other media now known or hereafter developed) is permitted.
DBS Group and its respective directors, officers and/or employees may have positions or other interests in, and may effect transactions in securities mentioned and may also perform or seek to perform broking, investment banking and other banking or financial services to any persons or entities mentioned.
To the maximum extent permitted by law, DBS Group accepts no liability for any losses or damages (including direct, special, indirect, consequential, incidental or loss of profits) of any kind arising from or in connection with any reliance and/or use of the information (including any error, omission or misstatement, negligent or otherwise) or further communication, even if DBS Group has been advised of the possibility thereof.
The information is not intended for distribution to, or use by, any person or entity in any jurisdiction or country where such distribution or use would be contrary to law or regulation. The information is distributed (a) in Singapore, by DBS Bank Ltd.; (b) in China, by DBS Bank (China) Ltd; (c) in Hong Kong, by DBS Bank (Hong Kong) Limited; (d) in Taiwan, by DBS Bank (Taiwan) Ltd; (e) in Indonesia, by PT DBS Indonesia; and (f) in India, by DBS Bank Ltd, Mumbai Branch.