

- Elements of an AI bubble are already in place amid rising valuation and concentration risks.
- However, unlike the dot-com bubble, today’s macro and policy conditions are far better supported.
- Ride the waves through “adapters” that embrace AI to improve operational efficiency, while remaining least impacted by the capex-revenue conundrum.
- Given the rising risk of fiscal dominance, protect portfolio values against inflation via real assets.
Related Insights
- Research Library12 Mar 2026
- Fixed Income Weekly: Oil Risks Muddle Inflation Outlook12 Mar 2026
- Global Aerospace: Holding Altitude Amid Middle East Turbulence 12 Mar 2026

A troubled world. Trump 2.0 has fundamentally reshaped the world. From the breakdown of the Transatlantic alliance to an unprecedented global tariff war, Trump has achieved all of this in a short span of time. The embrace of an America-first agenda means economic decoupling from the world, which irrevocably damages the post-WWII global consensus on free trade and international cooperation. In an attempt to disunite Russia and China, Trump executed a “reverse Kissinger” by trying to align with Russia on countering China’s rise – a move that unsettled traditional NATO allies and cast doubt on the commitment of the US’ security guarantees in Europe.
And yet, these geopolitical shifts are unfolding against a backdrop of spiralling US debt and unsustainable fiscal largesse. Trump’s One Big Beautiful Bill Act, which entailed unrestrained government spending and tax cuts, has all but confirmed the end of fiscal conservatism as the pursuit for short-term political advantage becomes the order of the day. Today, US debt-to-GDP stands at 100%, and based on projections by the Congressional Budget Office, it is expected to reach 107% by 2029 – exceeding the post-WWII peak of 106%. Rising debt levels mean rising interest payments, and at the current level of 17% (for fiscal year 2025), this amount already exceeds US defence spending.
In the new normal, portfolio constructors will have to brace for higher inflation as the Fed conducts monetary easing in a non-recessionary environment. Rising price pressures in services and housing are canaries in the coal mine for what lies ahead. It is important to note that the key driver of inflation is not so much tariffs or supply constraints; rather, it stems predominantly from the absence of an overarching fiscal framework to control the upward trajectory of public debt. Monetary policy alone is insufficient to contain inflation without fiscal consolidation. While the Fed controls the short end of the curve, long-term yields are determined by macroeconomic factors and inflation expectations. Unrestrained fiscal and monetary easing will only drive prices higher, with profound implications for risk assets and portfolio construction.

Deglobalisation vs capex super-cycle. Trump’s America-first agenda has ignited a global tariff war as the administration aims to bring manufacturing jobs home. Data from The Budget Lab at Yale shows the average effective tariff rate currently standing at 17.9% – the highest since 1934 – a situation that will have negative bearings on domestic consumption and corporate profitability. Prior to the current fiasco, it is important to note that deglobalisation began way before Brexit and the MAGA movement. Using imports as a percentage of GDP as a proxy, globalisation peaked in 2007 before declining in the aftermath of the Global Financial Crisis.
The negative impact of deglobalisation is two-fold. First, it results in lower trade flows as companies localise their supply chains. Second, it translates into higher production costs for companies, as manufacturing identical goods would be cheaper in other locations. Estimates by the World Trade Organization show that global trade volume will grow by just 1% per annum by 2030, compared to the 3% average growth seen in the prior two decades.
Despite tariff headwinds, we expect macro momentum to remain resilient, as weakness on the trade and consumption front will be offset by a new capex super-cycle powered by AI and defence spending. In AI, the anticipation of high returns from the technology must be accompanied by a significant ramp-up in data centre construction and energy supply. This explains why hyperscalers are aggressively increasing their data centre capacity, with combined capex expected to hit USD1.4tn between 2025 and 2027.
In the case of defence, the breakdown of the Transatlantic alliance has triggered a strategic rethink among NATO members regarding defence spending in the face of rising Russian aggression. Europe has since embarked on a multi-year rearmament programme, with NATO’s defence spending increasing from 2 to 5% of GDP, while the EU has also set up a EUR800bn “ReArm Europe” initiative.

Are we in a bubble?
We were very early in the game for the artificial intelligence (AI) theme, having published “CIO Vantage Point: Into the AI Frontier” back in Jun 2023.
Since then, the Bloomberg Artificial Intelligence Index has undergone a sharp rally as AI usage has seen wide adoption, particularly in the consumer space, where the number of daily users is expected to reach 378mn by 2025. Essentially, the rapid growth of AI is underpinned by two key factors: (1) the race to reach Artificial General Intelligence, and (2) the need to generate returns to justify capex spending. In a winner-takes-all technological race, the huge promises of AI have seen Big Tech pouring billions into the buildout of data centres. Amazon, Meta, Alphabet, and Microsoft, for instance, will be spending c.USD336bn on capex this year, the bulk of which is earmarked for AI infrastructure.
But the massive infrastructure build up, coupled with soaring valuations, will inevitably lead us to the following questions:
- Are we in an AI bubble?
- Is the AI capex boom overly excessive?
AI bubble – Demystified. In all innovation cycles, bubbles are created when the frenzied surge in share prices (which we are currently seeing) pushes valuations to a point where future cashflows can no longer justify them. A bubble signifies exuberance and a disconnect between prevailing market prices and fundamental underlying value. Looking back at history, several innovation-driven bubbles have occurred since the 1600s:
- Canal mania (1790s–1810s): Canals revolutionised transportation during the British Industrial Revolution as they offered a more reliable way to transport goods. The success of early canal projects sparked an investment mania, which ended once financing dried up during Britain’s war with France.
- Railway mania (1840s): Post-canal mania, railways sparked the next wave of transport revolution, garnering strong investment demand as interest rates fell. However, railway share prices eventually collapsed when interest rates rose in 1845.
- Dot-com bubble (1995–2000): The arrival of the Internet in the 1990s sparked an investment frenzy as investors poured funds into companies with little to no profits. The rally eventually came crashing down in Mar 2000, with most dot-com companies falling into bankruptcy.
To assess whether we are currently in bubble territory, we look at three key factors: (1) valuation, (2) liquidity, (3) concentration, and compare the current situation with the dot-com era.
- Valuation: In our analysis, we use the S&P 500 Shiller P/E ratio to provide a longer historical context. The S&P 500 serves as an “AI proxy” given that the bulk of the index is driven by the Magnificent Seven. At 39.5x P/E, valuation has exceeded the peak of 32.6x P/E seen right before the Wall Street crash of 1929. However, it remains 11% lower than the peak of 44.2x P/E registered during the dot-com bubble.
It is often said that tech companies generate strong free cash flow (FCF) and hence the valuation premium is justifiable. Using US Tech as proxy, this assumption is indeed true on a standalone basis, as FCF has increased by c.140% since 2015. However, this robust growth has been substantially priced in by the market, as share prices surged c.660% over the same period. This contributes to the downtrend in FCF yield, which at the current level of c.2.05%, is broadly similar to the dot-com era.

- Liquidity: Taking our analysis one step further, we examine the ratio of US tech relative to money supply (M2). Historically, an increase in money supply leads to higher asset prices as liquidity seeks a home. When money supply grows at a faster rate than economic fundamentals, valuations tend to be driven up (as is currently the case). Per the chart, the S&P 500 as a ratio to money supply has far exceeded the dot-com bubble era.
- Concentration: In equities, a market faces concentration risk when only a few stocks account for a large proportion of the index weight. During the peak of the “Internet era”, the top 10 largest US companies (including Microsoft, Intel, and IBM) constituted c.23% share of the index. The story today in the “AI era” is vastly different.
The top 10 US companies (including the likes of Nvidia, Microsoft, and Apple) account for c.41% of the index as of Nov 2025 – almost twice the level seen in the previous cycle. Over-concentration risk brings fragility to the rally, as the index becomes susceptible to sharp corrections should mega-cap companies fail to deliver on earnings and fall short of investors’ expectations.

Prevailing valuation, liquidity, and concentration data suggest that the key ingredients for a “bubble-like” environment are already in place. But not all bubbles are created equal. Some can stay inflated in the absence of external triggers (macroeconomic or otherwise) or if the bubble is anchored by companies with sound business models, which is currently the case. Using these parameters, we compare the dot-com era with the current situation:
Dot-com bubble: Back in the year 2000, the bursting of the dot-com bubble was triggered by a series of events:
- The Fed unleashed a series of rate hikes during 1999–2000, bringing the policy rate to 6.5%.
- An economic recession in Japan triggered a flight to safety.
- Dot-com companies traded at steep valuations with flawed business models and minimal revenue (or were loss-making).
Current situation: Compared to the dot-com era, the situation today shares some similarities but also key differences:
- The Fed is embarking on an easing cycle as the US jobs situation deteriorates.
- The plausibility of a global economic recession remains low at this juncture (though the outlook could evolve if the tariff situation worsens).
- Key AI players are Big Tech companies with strong cash flow generation and robust balance sheets.

AI capex boom – Demystified. The numbers are staggering: (1) Amazon, Alphabet, Oracle, Microsoft, and Meta have announced a combined capex of c.USD805bn on data centres for this year and the next, and (2) the BofA Global Research predicts total capex on data centres could hit close to USD1tn by 2030.
Yet, despite these astronomical numbers, the outlook for AI-related revenue remains modest. OpenAI, for instance, announced an annual recurring revenue of USD10bn, which is nowhere near the scale of capex spending. As companies continue to invest heavily in AI, obvious questions arise: Is this AI capex boom excessive? When will capex translate to shareholders’ returns?
As Big Tech announces their capex plans for 2026, the recent divergence in share price performance between Meta and Microsoft suggests rising scepticism about capex spending. To analyse this from a macro perspective, we look at capex spending as a percentage of GDP for some of the major bubbles over the past two centuries. The findings are:
- Capex as % of GDP: Despite the huge numbers announced, AI capex today as a percentage of GDP is estimated at only c.1.2%. Historically, this pales in comparison with the US railroad bubble (1850s–1890s) at c.5.0%, the auto infrastructure bubble (1950s–1970s) at c.3.0%, and more recently, the tech bubble (2000) at c.5.1%.
- Productivity gains: Unlike the tech bubble, the current AI capex cycle is contributing to earnings growth and productivity gains. Indeed, Big Tech has announced historical job cuts as they embrace AI and streamline operations. Since the launch of ChatGPT in Nov 2022, total job openings in the US have plunged c.33.7%. According to a Wharton study, the adoption of AI tools translates to labour cost savings of c.25% on average, growing to 40% in the coming decades.
No full-blown bubble yet; but no room for complacency. To conclude, as the table on the next page shows, some key elements of an AI bubble are already in place—particularly, rising valuations and concentration risks. However, unlike the previous tech bubble, today’s macro and policy conditions are far better supported. The economic outlook remains sanguine, and the Fed is on an easing cycle. Above all, despite the huge spending announced, Big Tech’s capex plans are manageable relative to GDP.

That said, there is also no room for complacency. The prevalence of “circular financing” is worrisome and warrants close monitoring. The recent spate of interconnected deals is raising eyebrows as they create an illusion of robust growth. Yet, the complexity surrounding these deals makes it difficult to fully assess real demand. Similarities between the current situation and “vendor financing” arrangements of the late 1990s are striking. This is an area to watch closely.


Portfolio Strategies for 2026
These are not normal times. While macro conditions and geopolitical uncertainties have improved, investors are confronted with steep valuations across all asset classes, from equities to corporate bonds and gold. Yet, as central banks turn on the liquidity tap again, inflation is poised to trend higher, making “staying in cash” an unviable option. Henceforth, navigating financial markets in 2026 will require skilful portfolio construction. Here are our key calls:
- Ride AI wave via “adapters”: The AI train is not going to end anytime soon, as investments continue to pour into this space. However, while riding the upside, one should remain cognisant of prevailing headwinds – namely heightened valuations and circular financing risks. Our preferred AI strategy is to gain exposure to “adapters” that embrace AI to improve operational efficiency while being least impacted by the capex-revenue conundrum. The plunge in job openings since the launch of ChatGPT is a clear sign that companies are leveraging AI to reduce workforces and streamline operations.
- Manage “sticky” inflation via real assets: As the Fed cuts rates in a non-recessionary environment, inflation is poised to grind higher. To protect portfolio values against inflation, investors are advised to gain exposure to real assets like infrastructure, real estate, commodities, and precious metals. Historically, real assets typically outperform in inflationary environments. Using silver as a proxy for real assets, the relative performance between silver and the S&P 500 (a proxy for financial assets) suggests that investor positioning has reached an extreme, presenting opportunities for those looking to diversify portfolios.
- Seek value plays via Asia ex-Japan equities: In the current “everything rally” environment, risk assets are priced for perfection, making it paramount to search for value in portfolio construction. In equities, we continue to favour Asia ex-Japan as the region trades at a c.32.4% discount to developed markets (DM), despite having stronger growth momentum. Based on consensus forecasts, Asia ex-Japan earnings are poised to grow at c.18.9% in 2026 (vs c.11.8% for DM equities). We see room for further rally in China equities as policy stimulus, AI-related capex resurgence, and the ”anti-involution” campaign underpin potential profit reflation in the market.
- Go for quality plays in both equities and credit: Post “Liberation Day”, the S&P 500 High Beta Index (which consists of stocks most sensitive to market movements) has vastly outperformed the S&P 500 Quality Index as investors rushed to gain exposure to the AI/Tech theme through high-beta speculative plays. Additionally, the increase in fund flows into leveraged ETFs has forced issuers to take enlarged positions in underlying securities. The outperformance of high beta stocks is now reaching an extreme and a reversal is on the cards. We reiterate our preference for quality equities, particularly if volatility spikes in the coming quarters.
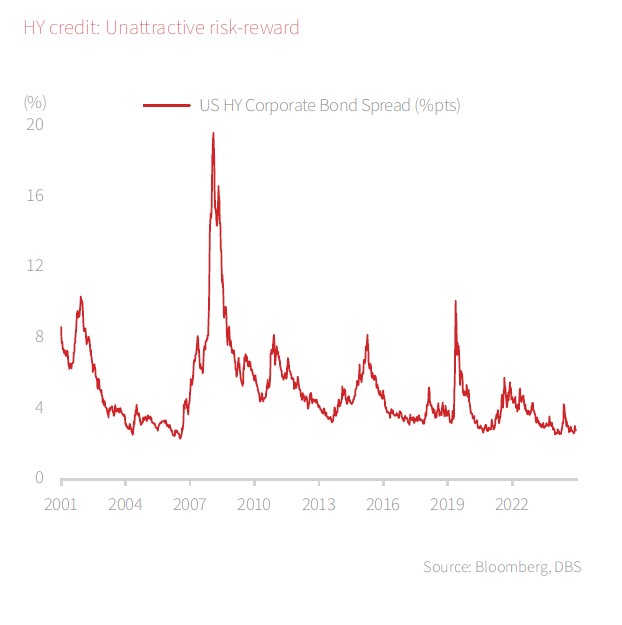
In a similar vein, we advocate for investors to stay in quality investment-grade (IG) bonds rather than gaining exposure to high-yield (HY) credit. Given prevailing tightness in spreads, HY credit outperformance is clearly reaching its limits, and any potential tightening of liquidity would pose substantial headwinds to the segment.


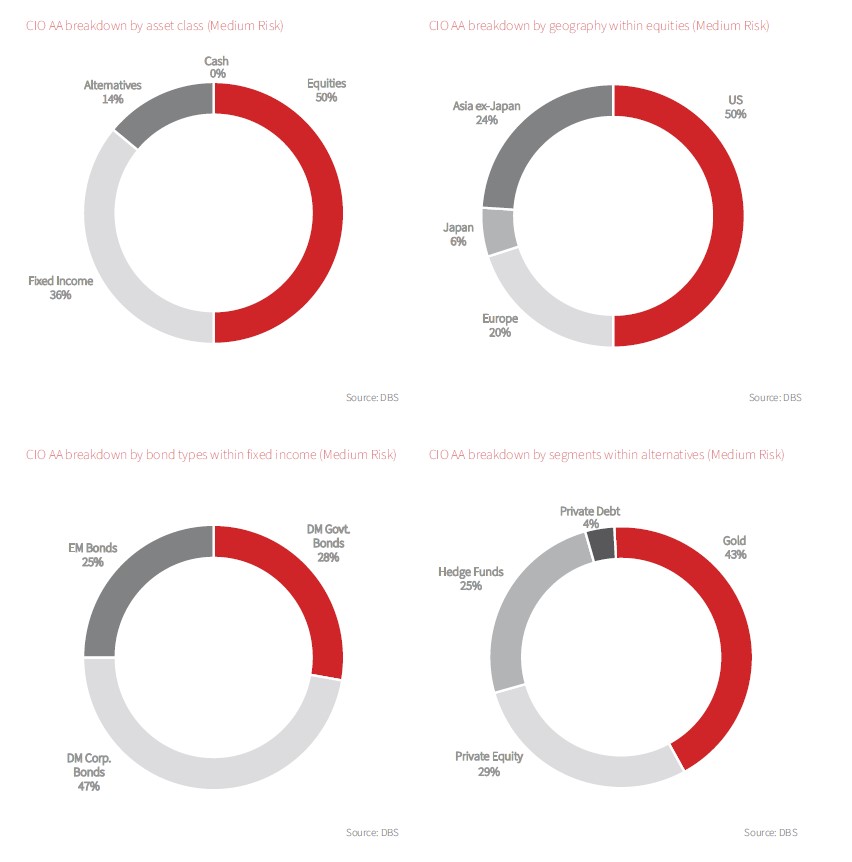
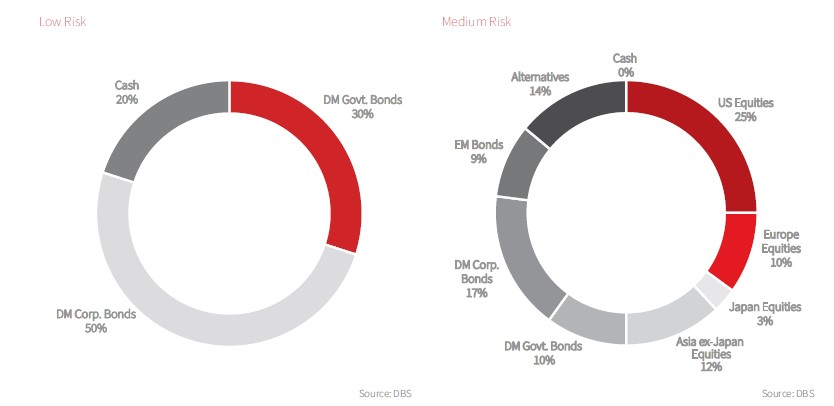
Cross Assets – Bonds remain in play. The latest scoring on our CIO AA framework indicates a preference for bonds over equities.
Fundamentals: Economic impulse in the US remains on the upswing with the Atlanta Fed GDPNow Indicator forecasting GDP growth of 4.0%, while surveys and professional forecasts compiled by Bloomberg suggest only a 30% chance of a US recession. This sanguine outlook aligns with our house view as we remain firmly in the no-recession camp, with US macro momentum underpinned by: (1) AI and energy-related investments, (2) strong fiscal stimulus in the form of tax cuts, and (3) monetary accommodation as the Fed embarks on an easing cycle. On corporate earnings, consensus expects global earnings growth of c.13% in 2026, with stronger momentum anticipated in Asia ex-Japan.
Valuation: On a cross-assets basis, we maintain our preference for bonds over equities as bond yields (using the UST 10Y yield as a proxy) remain substantially above the US earnings yield.
Momentum: Fund inflows into both global equities and bonds remained robust at USD105bn and USD86bn, respectively, during 4Q25 (as of 29 Oct). Compared to 9M25, equity momentum is marginally stronger this quarter as investors pile into the AI theme. Within equities, the US equities accounted for the bulk of inflows, given the dominance of tech exposure in the market. In fixed income, flows into DM government bonds have fallen substantially in 4Q25 as investors focused their attention on the corporate space.

Equities: Adopting a more targeted approach in equity allocation. Global equity valuations have expanded considerably since the trough of the “Liberation Day” sell-down. Consequently, our equity allocation strategy for 2026 requires a more nuanced approach. At this stage of the market cycle, we advise investors to focus on: (1) markets trading at steep valuation discount to global equities, and (2) sectors underpinned by secular growth drivers. Based on these criteria, our preferred picks are:
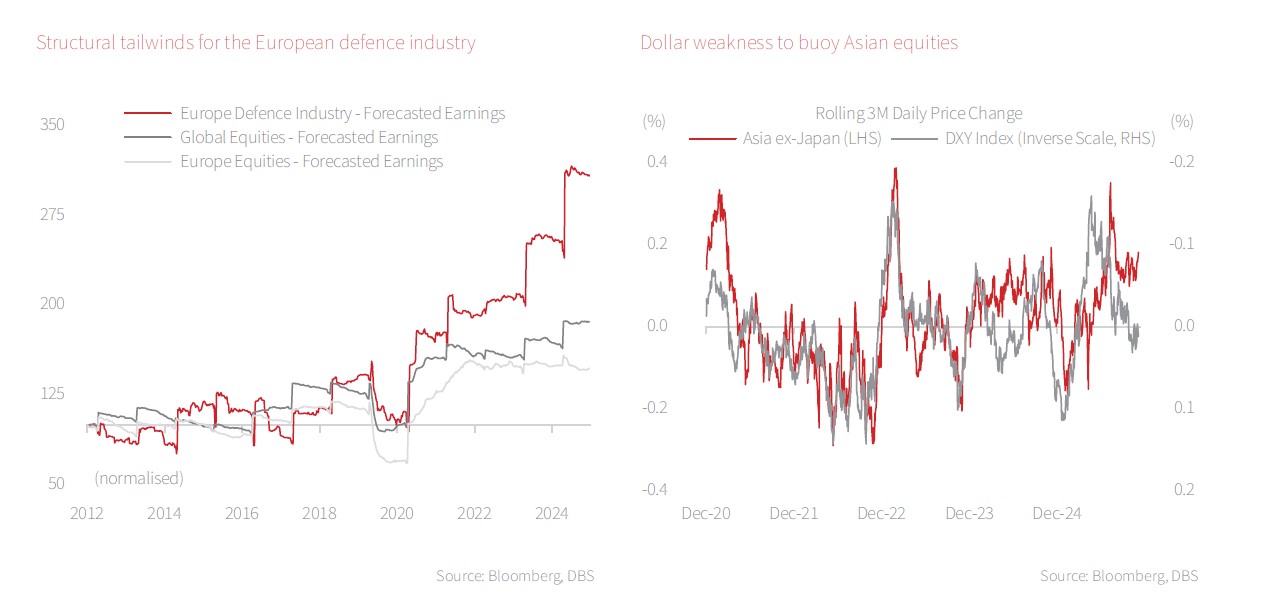
- Favour Asia ex-Japan equities amid dollar weakness and valuation discount: We expect dollar weakness to persist in 2026, with the DXY index reaching c.94.8 by 4Q26. Historically, dollar weakness tends to translate to stronger Asian equity performance given: (1) increased capital inflows, (2) lower interest expense for USD-denominated debt, and (3) higher commodity prices. Currently, Asia ex-Japan trades at a c.32.4% discount to developed markets, while its earnings growth outlook for 2026 is expected to be stronger at c.18.9%. We see further upside for China equities, propelled by the resurgence of AI-related capex and a stronger earnings outlook as result of the ”anti-involution” campaign.
- Favour European defence industry amid NATO rearmament pledge: European defence stocks have undergone substantial re-rating as Europe embarks on a multi-year rearmament programme to counter rising geopolitical uncertainties in the region. Russia’s invasion of Ukraine poses the biggest security threat to Europe since the Cold War. This, coupled with Trump’s America-first policy, has compelled NATO to increase its defence spending to 5% of GDP by 2035 (a 13% CAGR during 2024–2035). Such initiatives present significant tailwinds for the European defence industry which is poised to deliver 24% earnings growth in 2026 (vs 10% for the broader European market).
- Favour AI “adapters” for productivity gains: The huge capex outlays from AI plays will continue to dominate sentiments as investors assess monetisation potential of these investments. A better risk-adjusted way to ride the AI wave is via exposure to “adapters” that embrace AI to drive efficiency gains and higher profitability. On this basis, we believe large-cap companies are better positioned to scale this technology as opposed to smaller caps, which will translate to widening AI-related productivity divergence between large and small firms over time.
Bonds: Spread products to perform well despite rich valuation; maintain preference for IG over HY. While credit spreads are currently near historical tights, we do not foresee a substantial spread widening in 2026 as corporate balance sheets remain healthy. The likelihood of a recession next year is low, with macro momentum underpinned by strong fiscal easing, significant AI-related capex spending, and Fed accommodation. According to Bloomberg’s recession probability forecast, the likelihood of a US recession over the next year stands at 30%, down from the peak of 65% in 2023. Historically, barring sudden growth shocks, tight spreads tend to remain tight and we expect 2026 to be no different. On a relative basis, we see pronounced risk-reward imbalances for HY credit amid slowing growth momentum and tight spreads, which increases the potential for underperformance. Based on historical regression, our credit strategy team sees zero excess returns for HY credit on a 1Y basis if crisis-era distortions are excluded. Therefore, we maintain our preference for quality A/BBB credit in the 5-7Y bucket. Beyond corporate bonds, we also advocate exposure to government bonds like Treasury Inflation-Protected Securities (TIPS) and Mortgage-backed Securities (MBS) for alpha generation.
Alternatives: Looming “fiscal dominance” to underpin gold trajectory; private debt downgraded to neutral. The recent pullback in gold prices has prompted investors to question the sustainability of the rally. This is unsurprising as the precious metal has rallied sharply this year and vastly outperformed global equities. From a fundamental standpoint, we believe the catalysts that propelled gold to new highs this year will remain in play in 2026, namely: (1) US fiscal and debt sustainability concerns, (2) geopolitical and policy uncertainties, and (3) dollar debasement fears. We expect a combination of central bank demand and strong ETF flows to sustain gold prices in the year ahead.
On private assets, we are downgrading private debt to neutral, given that compressed spreads are translating into significantly lower premiums and valuations for the trade-off in liquidity are no longer compelling. We will revisit our stance if spread valuations offer better premiums. The weights from private debt will, in turn, be reallocated to beta-neutral strategies like hedge funds.


Topic
The information published by DBS Bank Ltd. (company registration no.: 196800306E) (“DBS”) is for information only. It is based on information or opinions obtained from sources believed to be reliable (but which have not been independently verified by DBS, its related companies and affiliates (“DBS Group”)) and to the maximum extent permitted by law, DBS Group does not make any representation or warranty (express or implied) as to its accuracy, completeness, timeliness or correctness for any particular purpose. Opinions and estimates are subject to change without notice. The publication and distribution of the information does not constitute nor does it imply any form of endorsement by DBS Group of any person, entity, services or products described or appearing in the information. Any past performance, projection, forecast or simulation of results is not necessarily indicative of the future or likely performance of any investment or securities. Foreign exchange transactions involve risks. You should note that fluctuations in foreign exchange rates may result in losses. You may wish to seek your own independent financial, tax, or legal advice or make such independent investigations as you consider necessary or appropriate.
The information published is not and does not constitute or form part of any offer, recommendation, invitation or solicitation to subscribe to or to enter into any transaction; nor is it calculated to invite, nor does it permit the making of offers to the public to subscribe to or enter into any transaction in any jurisdiction or country in which such offer, recommendation, invitation or solicitation is not authorised or to any person to whom it is unlawful to make such offer, recommendation, invitation or solicitation or where such offer, recommendation, invitation or solicitation would be contrary to law or regulation or which would subject DBS Group to any registration requirement within such jurisdiction or country, and should not be viewed as such. Without prejudice to the generality of the foregoing, the information, services or products described or appearing in the information are not specifically intended for or specifically targeted at the public in any specific jurisdiction.
The information is the property of DBS and is protected by applicable intellectual property laws. No reproduction, transmission, sale, distribution, publication, broadcast, circulation, modification, dissemination, or commercial exploitation such information in any manner (including electronic, print or other media now known or hereafter developed) is permitted.
DBS Group and its respective directors, officers and/or employees may have positions or other interests in, and may effect transactions in securities mentioned and may also perform or seek to perform broking, investment banking and other banking or financial services to any persons or entities mentioned.
To the maximum extent permitted by law, DBS Group accepts no liability for any losses or damages (including direct, special, indirect, consequential, incidental or loss of profits) of any kind arising from or in connection with any reliance and/or use of the information (including any error, omission or misstatement, negligent or otherwise) or further communication, even if DBS Group has been advised of the possibility thereof.
The information is not intended for distribution to, or use by, any person or entity in any jurisdiction or country where such distribution or use would be contrary to law or regulation. The information is distributed (a) in Singapore, by DBS Bank Ltd.; (b) in China, by DBS Bank (China) Ltd; (c) in Hong Kong, by DBS Bank (Hong Kong) Limited; (d) in Taiwan, by DBS Bank (Taiwan) Ltd; (e) in Indonesia, by PT DBS Indonesia; and (f) in India, by DBS Bank Ltd, Mumbai Branch.
Related Insights
- Research Library12 Mar 2026
- Fixed Income Weekly: Oil Risks Muddle Inflation Outlook12 Mar 2026
- Global Aerospace: Holding Altitude Amid Middle East Turbulence 12 Mar 2026
Related Insights
- Research Library12 Mar 2026
- Fixed Income Weekly: Oil Risks Muddle Inflation Outlook12 Mar 2026
- Global Aerospace: Holding Altitude Amid Middle East Turbulence 12 Mar 2026