

- Consensus expectations of c.27% y/y earnings growth in 2Q26 are triggering concerns of an earnings bubble in the S&P 500
- Earnings concerns are unfounded, as the robust momentum is underpinned by the AI capex cycle, which benefits both tech and non-tech companies
- US financials delivered strong 2Q26 earnings, with AI-related catalysts buoying both trading activity and investment banking fees
- Ride the broadening rally via US financials; deregulation is expected to ease capital constraints, support loan growth, and unlock advisory fee opportunities
Related insights
- Policy Expectations on Watch21 Aug 2026
- FX Tactical Ideas: Increasing Pressure on the USD21 Aug 2026
- Research Library21 Aug 2026

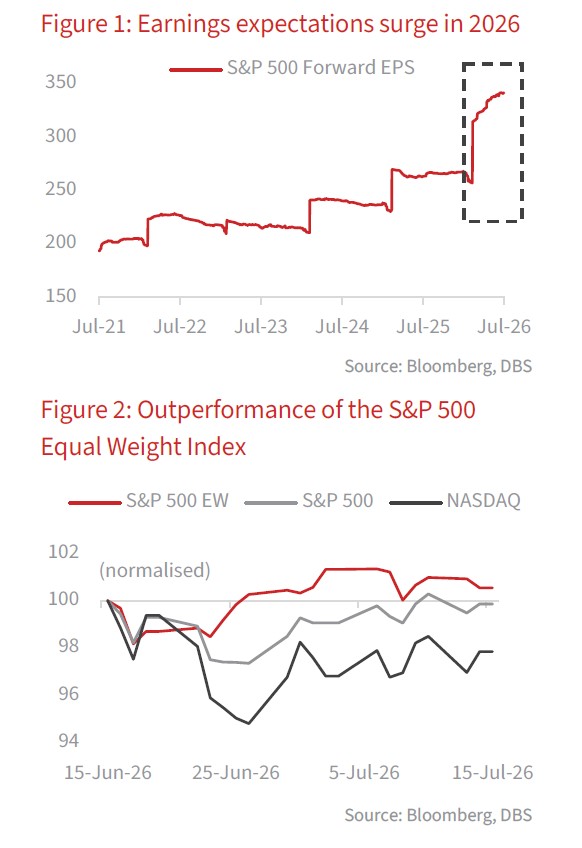
US earnings focus: Sensitivity of corporate earnings to forward valuations. Market expectations are high as we head into the 2Q26 earnings season, with consensus forecasting US earnings growth of c.27% y/y in 2Q26. Paradoxically, the robust outlook is fuelling concerns of an "earnings bubble" in the US and the impact it could have on valuations should companies fail to deliver on the earnings front. The US currently trades at 20.3x forward P/E, premised on 26.8% EPS growth on a rolling 12-month basis. As an illustration, a 5 %pts disappointment in the earnings forecast would bring forward P/E to 21.1x, while a 10 %pts disappointment would raise valuations to 22.0x, approximately 1 SD above the 10-year average.
Concerns of a US earnings bubble unfounded; AI capex cycle underpinning robust momentum. Prevailing market concerns of a US "earnings bubble" are unfounded in our view, as the robust momentum is underpinned by the multi-year AI capex cycle. Apart from technology companies, the latter is also positive for non-tech plays. Case in point: US financials.
The sector delivered stellar earnings results in 2Q26. While trading played a key role in driving revenue growth, investment banking activities also contributed to the upside as increasing funding needs from AI capex translate to higher equity and debt capital market activity. According to PR Newswire, the technology sector alone accounted for c.32% of US ECM issuance deal value in 1H26. JPMorgan, for instance, saw trading revenue grow 35% y/y to USD12.1bn, while investment banking fees also surged 30% y/y.
Ride the broadening rally through US financials. The US equity rally is broadening, as evidenced by the recent outperformance of S&P 500 Equal Weight Index over its market-cap-weighted counterpart and the tech-heavy Nasdaq Composite. The recent price action suggests investors are increasingly rotating from tech to non-tech plays. To ride this broadening trend, we reiterate our overweight stance on US financials. Beyond robust 2Q26 earnings, we believe the following factors will drive sustained profitability for the sector:
- Net Interest Income (NII): Mar 2026 revisions to the Basel III Endgame will lower capital requirements for the largest US banks, easing balance sheet constraints and increasing lending capacity. This should support stronger loan growth and underpin NII expansion. Furthermore, the Fed has turned increasingly hawkish compared to the start of the year, driven by persistent core inflation and higher energy prices. The market is currently pricing in c.100% probability of one additional rate hike and a 9.2% probability of a second hike by year-end. This higher-for-longer rate environment will, in turn, drive Net Interest Margin expansion, providing support for earnings.
- Advisory fee income: The Trump administration’s pro-business stance may include a softer antitrust approach and faster approval timelines. This could, in turn, unlock pend-up demand for capital market activity, driving advisory fee income higher. According to Institute of Mergers, Acquisitions, and Alliances, the value of announced 2026 US M&A transactions in North America is expected to see a robust growth of c.25%, rising from USD3.2tn in 2025 to USD4.0tn in 2026.
Download the PDF to read the full report which includes coverage on Credit, FX, Rates, and Thematics.
Topic
The information published by DBS Bank Ltd. (company registration no.: 196800306E) (“DBS”) is for information only. It is based on information or opinions obtained from sources believed to be reliable (but which have not been independently verified by DBS, its related companies and affiliates (“DBS Group”)) and to the maximum extent permitted by law, DBS Group does not make any representation or warranty (express or implied) as to its accuracy, completeness, timeliness or correctness for any particular purpose. Opinions and estimates are subject to change without notice. The publication and distribution of the information does not constitute nor does it imply any form of endorsement by DBS Group of any person, entity, services or products described or appearing in the information. Any past performance, projection, forecast or simulation of results is not necessarily indicative of the future or likely performance of any investment or securities. Foreign exchange transactions involve risks. You should note that fluctuations in foreign exchange rates may result in losses. You may wish to seek your own independent financial, tax, or legal advice or make such independent investigations as you consider necessary or appropriate.
The information published is not and does not constitute or form part of any offer, recommendation, invitation or solicitation to subscribe to or to enter into any transaction; nor is it calculated to invite, nor does it permit the making of offers to the public to subscribe to or enter into any transaction in any jurisdiction or country in which such offer, recommendation, invitation or solicitation is not authorised or to any person to whom it is unlawful to make such offer, recommendation, invitation or solicitation or where such offer, recommendation, invitation or solicitation would be contrary to law or regulation or which would subject DBS Group to any registration requirement within such jurisdiction or country, and should not be viewed as such. Without prejudice to the generality of the foregoing, the information, services or products described or appearing in the information are not specifically intended for or specifically targeted at the public in any specific jurisdiction.
The information is the property of DBS and is protected by applicable intellectual property laws. No reproduction, transmission, sale, distribution, publication, broadcast, circulation, modification, dissemination, or commercial exploitation such information in any manner (including electronic, print or other media now known or hereafter developed) is permitted.
DBS Group and its respective directors, officers and/or employees may have positions or other interests in, and may effect transactions in securities mentioned and may also perform or seek to perform broking, investment banking and other banking or financial services to any persons or entities mentioned.
To the maximum extent permitted by law, DBS Group accepts no liability for any losses or damages (including direct, special, indirect, consequential, incidental or loss of profits) of any kind arising from or in connection with any reliance and/or use of the information (including any error, omission or misstatement, negligent or otherwise) or further communication, even if DBS Group has been advised of the possibility thereof.
The information is not intended for distribution to, or use by, any person or entity in any jurisdiction or country where such distribution or use would be contrary to law or regulation. The information is distributed (a) in Singapore, by DBS Bank Ltd.; (b) in China, by DBS Bank (China) Ltd; (c) in Hong Kong, by DBS Bank (Hong Kong) Limited; (d) in Taiwan, by DBS Bank (Taiwan) Ltd; (e) in Indonesia, by PT DBS Indonesia; and (f) in India, by DBS Bank Ltd, Mumbai Branch.
Related insights
- Policy Expectations on Watch21 Aug 2026
- FX Tactical Ideas: Increasing Pressure on the USD21 Aug 2026
- Research Library21 Aug 2026
Related insights
- Policy Expectations on Watch21 Aug 2026
- FX Tactical Ideas: Increasing Pressure on the USD21 Aug 2026
- Research Library21 Aug 2026