

- Maintain high conviction overweight on technology due to robust earningsmomentum and strong cash position. Rally broadening beyond tech
- Drivers for the rally include loose financial conditions, low interestexpense ratios, and the continued resilience of the US economy
- Energy near trough as under weight portfolio positioning suggest negativeheadwinds have been priced in. Tailwinds include high dividend and buy back yield
- Upgrade materials on rising possibility of a soft landing and current light portfolio positioning
- Downgrade financials to neutral andreal estate to underweight to fund upgrade of energy to overweight and materials to neutral

Related insights_tr
- Macro Insights Livestream: Thursday May 9th - 4pm SGT 03 May 2024
- Singapore Equity Picks02 May 2024
- Global Sports Apparel: Reposition against Rising Players02 May 2024

A broadening rally for S&P 500 on the cards. In our asset allocation chapter, we opined that despite the strong rally this year, valuation for non-technology companies on the S&P 500 are looking fair from a historical standpoint. Therefore, a broadening rally for the US market is plausible and some of the drivers include:
- Loose financial conditions: US financial conditions have remained loose in spite ofelevated bond yields. Based on regression, prevailing financial conditions suggestearnings growth of 10% for 2024, auguring well for the S&P 500 outlook.
- Low interest expense ratio: Post-Subprime crisis, US companies refinanced theirliabilities at low interest rates as central banks embarked on aggressive monetaryeasing. Interest expense ratio has since hit a low of 6.8% (despite elevated bondyields) and this is positive for corporate profitability.
- US economic resilience: The US economy has remained resilient despite Fedmonetary tightening. GDP grew 3.3% q/q (on annualised basis) in 4Q23 and vastlyexceeded consensus forecast. The healthy jobs market and wealth effects arisingfrom asset price gains is expected to underpin domestic consumption.
Beneficiaries of broadening trend – energy and materials. To help investors position for a potential broadening of the rally, we conducted a basic screening exercise for sectors on the S&P 500. The criteria comprised: (1) sectoral performance since the market trough on 27 Oct 2023, and (2) investors’ sectoral allocation in US equity portfolios.
Listed below are our findings:
- Sectoral performance: Since the market trough in October last year, the S&P 500 hasrallied 25.3% (as of 7 Mar). The four sectors that outperformed the broader marketare technology (+34.7%), financials (+28.6%), communication services (+27.8%), andindustrials (+26.9%).
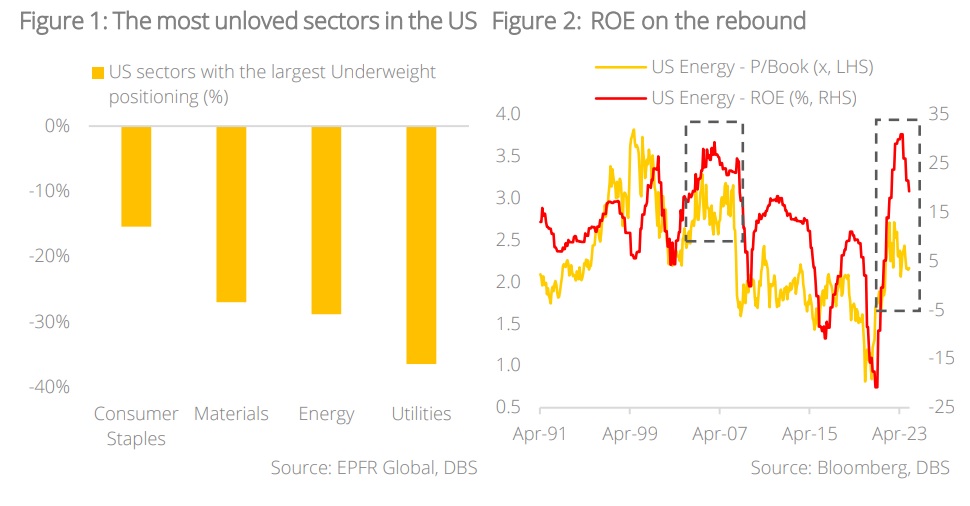
At the other end of spectrum, the top five underperformers are energy (+2.7%),utilities (+7.5%), consumer staples (14.1%), healthcare (+19.0%), and materials(+19.7%). - Sectoral positioning: Within the basket of top five underperforming sectors, data fromEPFR Global shows that those marked “underweight” by portfolio allocators relative tobenchmark are: utilities (-36%), energy (-29%), materials (-27%), and consumer staples(-15%).
In our US sector allocation, we are upgrading energy to overweight and in the event of a broadening rally, we believe the sector will be a geared beneficiary given:
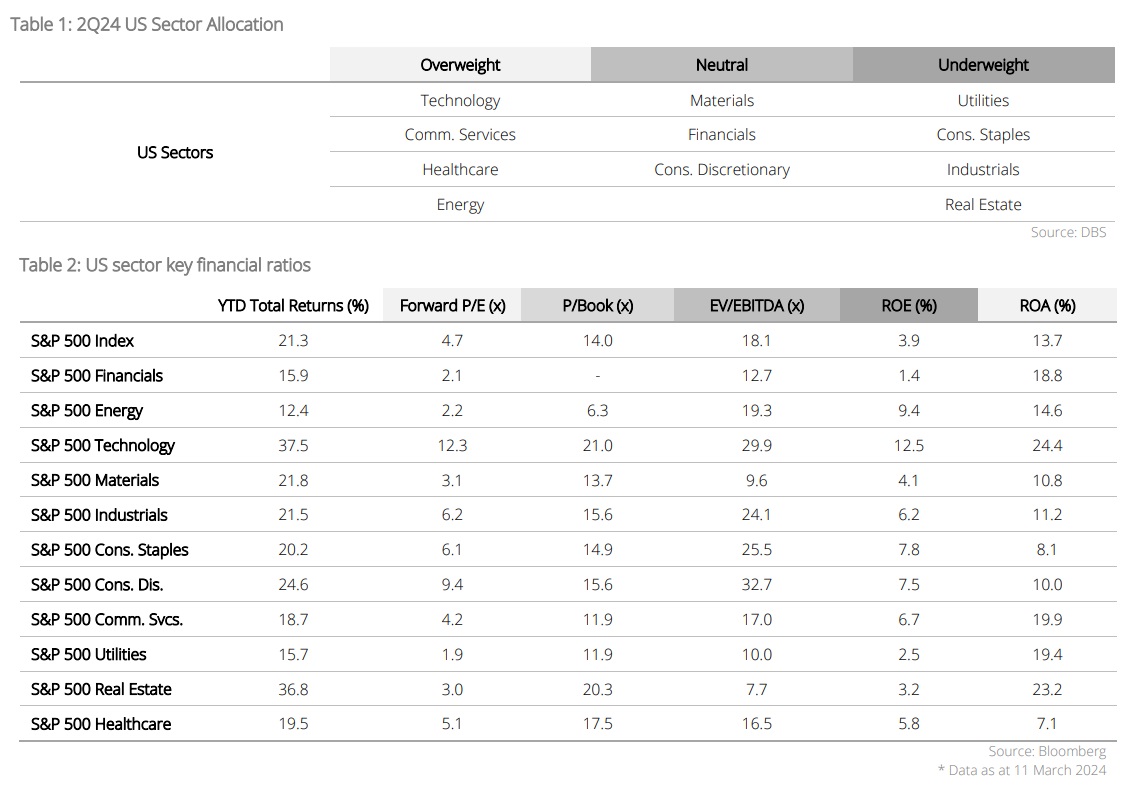
- Improving ROE: The ROE for energy is on the rebound, up from -20.8% in Apr 2021 to 19.3% in Feb 2024. But despite the up move, the P/B ratio remained low at 2.2x (unlike levels seen in 2005-08).
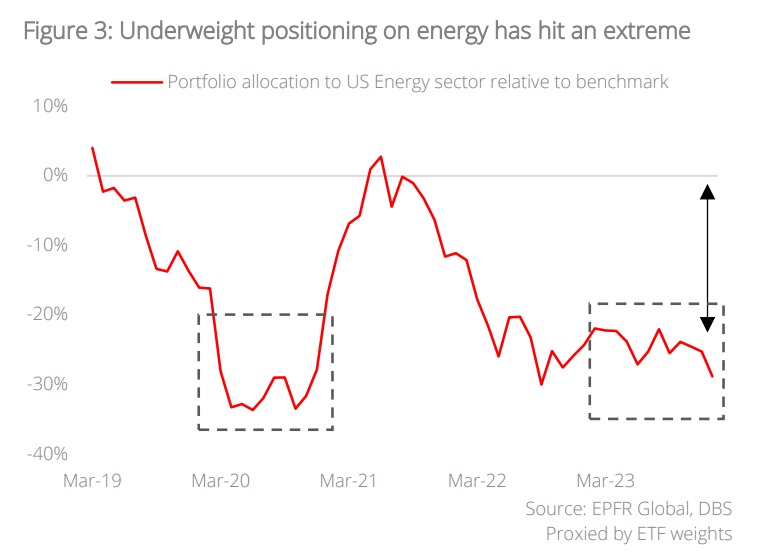
- Light portfolio positioning: Underweight positioning on the energy sector has hit a low of -28.8% amongst US portfolio allocators. This is broadly in-line with the extreme levels seen in 2020 and substantially worse than the long-term average of -17.8%. The massive underweight positioning on energy suggests that investors’ expectations are low as substantial negative headwinds have already been priced in.
Additionally, we are also upgrading materials to neutral as we believe the sector will be another geared beneficiary of a broadening rally and the drivers are:
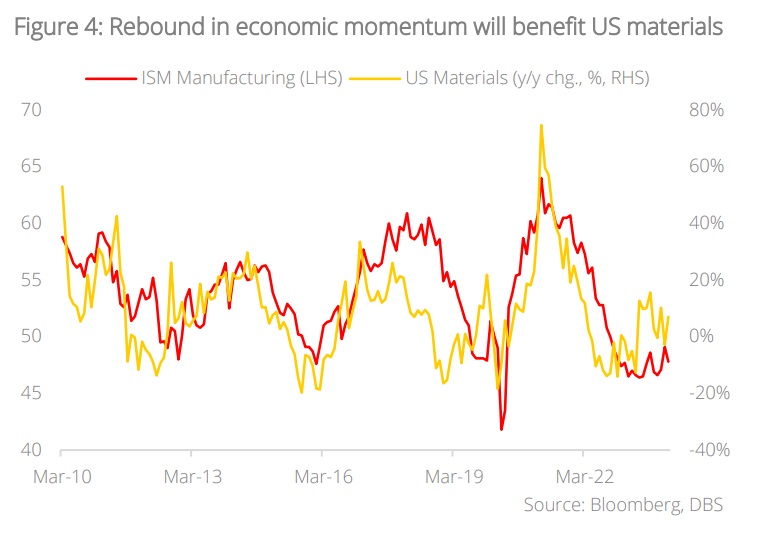
- Economic soft landing: Given the broad-based resilience of the US economy,probability of a soft landing is on the rise and should this scenario transpire, webelieve materials will see upside momentum in the coming months. Sectoralperformance has historically correlated with ISM Manufacturing and clearly, an uptickin economic activities will augur well for this space.
- Light portfolio positioning: Underweight positioning on materials currently stands at-27.0% amongst US portfolios. This suggests investors’ positioning is light andexpectations are low.
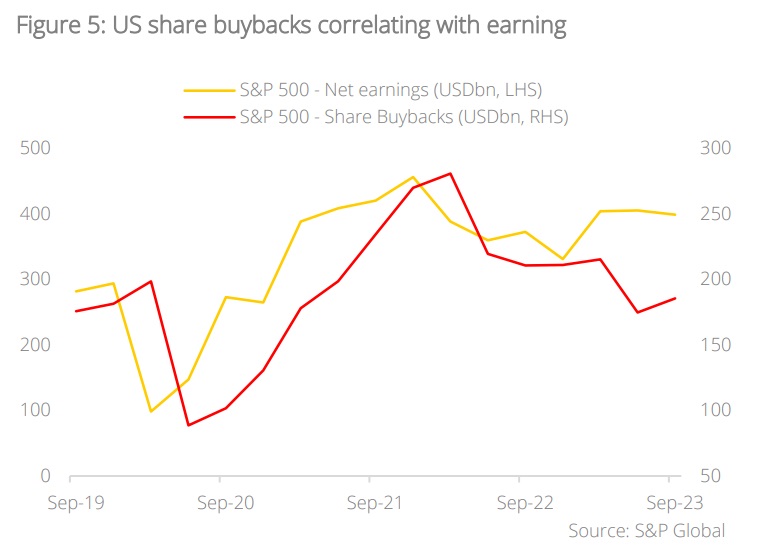
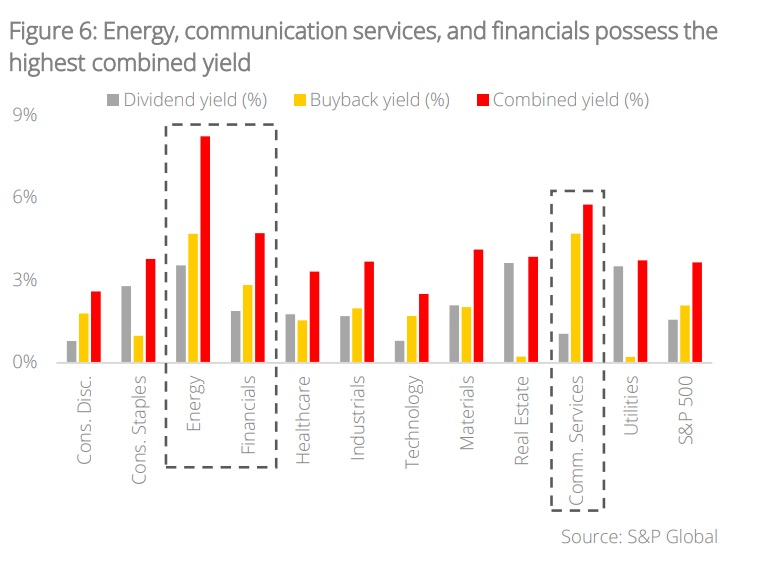
S&P 500 share buybacks to rise in 2024 as earnings rebound. Based on data from S&P Global, share buybacks for S&P 500 totalled USD576.1bn in 3Q23 and this constitutes a 19% y/y decline from 3Q22. This should not come as a surprise as share buybacks historically correlate with corporate earnings and the latter was down 0.9% last year (on a full year basis).
By the same token, given consensus expectation of 10% earnings growth this year, we would expect share buybacks to see meaningful rebound as well. Communications services and energy have the highest buyback yield of 4.7%, followed by financials at 2.8%. On a combined yield basis (consisting of dividends and buybacks), the highest are energy (8.2%), communications services (5.8%), and financials (4.7%).
2Q24 US Sector Strategy – Upgrading energy and materials; Downgrading financials and real estate
Strong performance of CIO’s sectoral calls persisted in 1Q24. Our overweight calls registered average total returns of 9.3% in 1Q24 (as of 11 Mar), outperforming our neutral calls by 6.5 %pts and underweight calls by 4.5 %pts. Within our overweight basket, technology registered the largest gains of 10.9%, followed by communications services at 10.6%, and financials at 8.2%. Healthcare, traditionally a defensive sector, also garnered healthy gains of 7.4% during the quarter.
In our neutral basket, the biggest drag on performance was the real estate space (-0.2%) while within the underweight calls, the main underperformer was utilities (+1.1%).
Maintain conviction view on tech-related plays; Turning positive on energy. Our high conviction call on tech-related sectors has paid off handsomely and we maintain our positive view on this space. Despite the strong run-up since late last year, we believe the strong momentum will persist given:
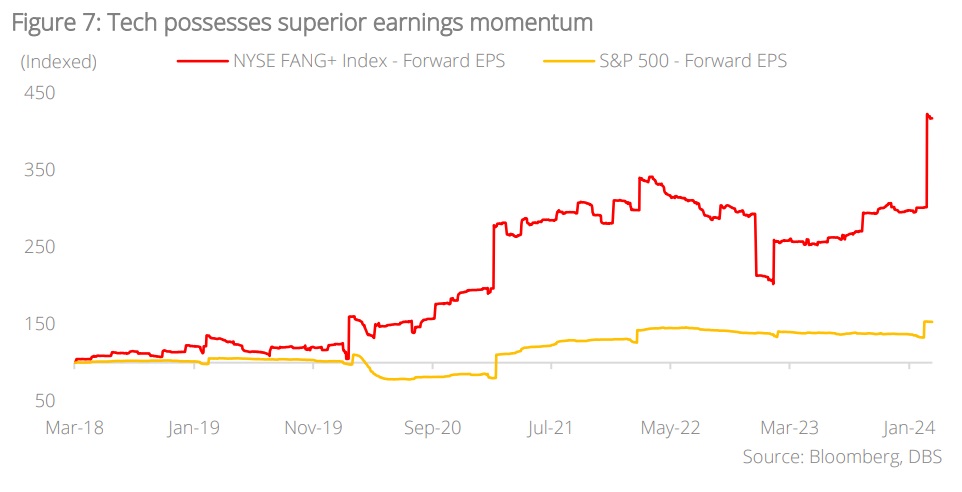
- Robust earnings momentum: The technology sector is expected to deliver earnings growth of 21% this year and it far supersedes the 10% growth expected from the broader market. Using the NYSE FANG+ Index as proxy, the momentum for “Big Tech” is even stronger with earnings growth expected at 44% in 2024.
- Strong cash holdings: “Big Tech” companies possess large cash holdings that will empower them to pursue M&A opportunities to deepen their product/service offerings as well as enhance their “moat” qualities. Today, the total cash holdings of the “Magnificent Seven” stand at USD240bn (as of Dec 2023).
Separately, we are also upgrading energy to overweight given (1) improving ROE, (2) high dividend and buyback yield, and (3) light portfolio positioning and low expectations. This overweight positioning will be funded by our downgrade of financials to neutral. In addition, we are also upgrading materials to neutral on expectations of an economic soft landing and this shift will be funded by our downgrade of real estate to an underweight.
Topic
The information published by DBS Bank Ltd. (company registration no.: 196800306E) (“DBS”) is for information only. It is based on information or opinions obtained from sources believed to be reliable (but which have not been independently verified by DBS, its related companies and affiliates (“DBS Group”)) and to the maximum extent permitted by law, DBS Group does not make any representation or warranty (express or implied) as to its accuracy, completeness, timeliness or correctness for any particular purpose. Opinions and estimates are subject to change without notice. The publication and distribution of the information does not constitute nor does it imply any form of endorsement by DBS Group of any person, entity, services or products described or appearing in the information. Any past performance, projection, forecast or simulation of results is not necessarily indicative of the future or likely performance of any investment or securities. Foreign exchange transactions involve risks. You should note that fluctuations in foreign exchange rates may result in losses. You may wish to seek your own independent financial, tax, or legal advice or make such independent investigations as you consider necessary or appropriate.
The information published is not and does not constitute or form part of any offer, recommendation, invitation or solicitation to subscribe to or to enter into any transaction; nor is it calculated to invite, nor does it permit the making of offers to the public to subscribe to or enter into any transaction in any jurisdiction or country in which such offer, recommendation, invitation or solicitation is not authorised or to any person to whom it is unlawful to make such offer, recommendation, invitation or solicitation or where such offer, recommendation, invitation or solicitation would be contrary to law or regulation or which would subject DBS Group to any registration requirement within such jurisdiction or country, and should not be viewed as such. Without prejudice to the generality of the foregoing, the information, services or products described or appearing in the information are not specifically intended for or specifically targeted at the public in any specific jurisdiction.
The information is the property of DBS and is protected by applicable intellectual property laws. No reproduction, transmission, sale, distribution, publication, broadcast, circulation, modification, dissemination, or commercial exploitation such information in any manner (including electronic, print or other media now known or hereafter developed) is permitted.
DBS Group and its respective directors, officers and/or employees may have positions or other interests in, and may effect transactions in securities mentioned and may also perform or seek to perform broking, investment banking and other banking or financial services to any persons or entities mentioned.
To the maximum extent permitted by law, DBS Group accepts no liability for any losses or damages (including direct, special, indirect, consequential, incidental or loss of profits) of any kind arising from or in connection with any reliance and/or use of the information (including any error, omission or misstatement, negligent or otherwise) or further communication, even if DBS Group has been advised of the possibility thereof.
The information is not intended for distribution to, or use by, any person or entity in any jurisdiction or country where such distribution or use would be contrary to law or regulation. The information is distributed (a) in Singapore, by DBS Bank Ltd.; (b) in China, by DBS Bank (China) Ltd; (c) in Hong Kong, by DBS Bank (Hong Kong) Limited; (d) in Taiwan, by DBS Bank (Taiwan) Ltd; (e) in Indonesia, by PT DBS Indonesia; and (f) in India, by DBS Bank Ltd, Mumbai Branch.
Related insights_tr
- Macro Insights Livestream: Thursday May 9th - 4pm SGT 03 May 2024
- Singapore Equity Picks02 May 2024
- Global Sports Apparel: Reposition against Rising Players02 May 2024
Related insights_tr
- Macro Insights Livestream: Thursday May 9th - 4pm SGT 03 May 2024
- Singapore Equity Picks02 May 2024
- Global Sports Apparel: Reposition against Rising Players02 May 2024