

- Despite the Fed’s reluctance in declaring victory in its inflation fight while maintaining overall ambiguity on policy timeline, risk assets are already off to the races
- Investors have swiftly priced-in the eventual Fed easing this year with the S&P 500 rallying 8% and US HY spread tightening 22 bps
- A broadening of the current rally is on the cards, driven by loose financial conditions, low interest expense ratio, favourable portfolio positioning, and US economic resilience
- The key tactical asset allocation calls we are making for 2Q24 are: 1) Asia ex-Japan equities roaring back to life; maintain overweight view; 2) Attractive risk-reward relative to equities; Maintain preference for IG credit in 3-5Y segment; 3) Seek resilience in gold amid geopolitical uncertainties; 4) Gain exposure to private assets for greater diversity in investment opportunities

Related insights_tr
- Macro Insights Livestream: Thursday May 9th - 4pm SGT 03 May 2024
- Singapore Equity Picks02 May 2024
- Global Sports Apparel: Reposition against Rising Players02 May 2024

The much-anticipated pullback in US economic momentum failed to transpire despite long-end Treasury yields ranging at 2008-10 levels. In fact, the combination of a red-hot US jobs market and robust wage growth has prompted the Fed to rule out policy rate cuts until May at least. And as expected, the central bank kept its decision-making process intentionally vague by insisting on the need to see “more good data” before acting.
But without specifics on what “more good data” refers to, clearly, the bar for monetary easing has been set high and for good reason. As inflation falls towards the 2% target while unemployment remains low at 3.7% – the central bank has essentially fulfilled its dual mandate of maximum employment and price stability. In the words of Fed Chair Powell, this is indeed “a good economy” where there is little urgency in cutting rates.
But despite the Fed’s reluctance in declaring victory in its inflation fight while maintaining overall ambiguity on policy timeline, risk assets are already off to the races. Investors have swiftly priced-in the eventual Fed easing this year with the S&P 500 rallying 8% and US HY spread tightening 22 bps.
After such a strong rally, the pertinent question is: Have risk assets reached the “exuberance” stage?
On the surface, market indicators do suggest some degree of froth in the market. The ratio for cyclical equities over non-cyclicals, for instance, is currently at a level which is more closely associated with ISM manufacturing of 64.5 (vs 47.8 currently). Similarly in bonds, yields are also at levels that are associated with stronger macro momentum. Evidently, there is a disconnect between the real economy and what markets are telling us.

But nuances matter here. While equity markets appear exuberant if viewed from the lenses of broad indices, one has to be mindful that this year’s rally is predominantly driven by a narrow group of technology-related stocks – the “Magnificent 7” (Apple, Alphabet, Amazon, Microsoft, Meta, Nvidia, and Tesla) which account for significant weights on the S&P 500. If the market is viewed from an equal-weighted basis, the picture is drastically different.
To set things in context, we analyse the prevailing valuations for Nasdaq and S&P 500 (on equal weighted basis). The Nasdaq is used to gauge the level of investors’ exuberance on technology-related stocks while the S&P 500 (equal weighted) is positioned as a proxy for companies representing the real economy.
- Nasdaq – Valuation exceeding +2SD: The long-term average forward P/E for Nasdaq stands at 25.0x and the current level of 40.0x suggests that valuation has exceeded the two SD “expensive” mark
- S&P 500 (equal weighted) – Valuation below long-term average: Long-term average forward P/E for S&P 500 (equal weighted) stands at 17.7x and the current level of 17.4x is below its long-term average
The valuation numbers bring to light the huge bifurcations prevailing in markets. If one excludes the full impact from technology-related plays, valuation for non-technology companies in traditional industries are actually looking fair at this juncture.


Now, if the broader equity market is not in exuberance stage, what about the tech space? Is a repeat of 2000’s dot-com crash on the cards after the strong rally?
For baby boomers, in particular, the technology crash of 2000 was a painful episode. Understandably, it is only natural for one to question if the current AI-fuelled tech rally is a replay of the Internet bubble. But times have changed. Conditions today are vastly different from the late-90s, in particular on the corporate earnings front:
- To recap, using the S&P 500 Technology index as proxy for the technology-related space, the latter peaked in Mar 2000 during the dot-com bubble. On a 3-year time frame, the index has rallied 357% since Mar 1997 and this was underpinned by a 27% increase in forward earnings and 260% expansion in valuation multiple.
- In the current rally, the index has gained 63% on a similar 3-year timeframe to close at 3748.6 in Feb 2024. This up-move is underpinned by a 47% increase in forward earnings growth and 11% expansion in valuation multiple.
Taken together, data shows that the current bull run is supported by strong earnings fundamentals (as opposed to valuation multiples expansion) and hence, a repeat of 2000’s tech crash is unlikely.
Given the absence of exuberance in “real economy” stocks, we believe that a broadening of the current rally is forthcoming and the drivers are:
- Loose financial conditions
- Low interest expense ratio
- Favourable portfolio positioning
- US economic resilience
Loose financial conditions augur well for corporate earnings trajectory. Financial conditions indices offer insights on the health of the financial system and by extension, the market’s economic growth prospects. We adopt the Goldman Sachs US Financial Conditions Index (GSFCI) in our analysis and the key variables captured include Treasury yields, exchange rate, credit spreads, and equity valuation
Despite bond yields staying elevated, US financial conditions have surprisingly remained loose. The prevailing level of 99.22 suggests that financial conditions today are similar to levels seen when the Fed Funds rate was languishing near the zero-bound. Clearly, the negative impact arising from elevated bond yields is offset by surging equity prices and narrowing US credit spreads.


Historically, the degree of looseness in financial conditions exhibited a close inverse relationship with corporate earnings growth. Based on regression, prevailing financial conditions are broadly associated with earnings growth of 10% and this coincides with the consensus forecast of 10% growth for 2024 (vs average earnings growth of 7% during 2008-2023). This augurs well for the outlook of equities.
Low interest expense ratio underpins corporate profitability. A recap from our 4Q23 CIO Insights – a company’s interest expense ratio is expected to increase as policy rate rises and historically, this has been the case. In the 1988-89 and 1999-2000 rate hiking cycles, the peaking of the Fed Funds rate coincided with similar peaking of interest expense ratio in the subsequent six quarters. More recently in the 2004-06 rate hiking cycle, the interest expense ratio peaked 12 quarters after the policy rate plateaued.
If the above analysis is correct, then it will have a major impact on the Fed’s policy trajectory in 2024. When economies first reopened and drove inflation higher, the Fed reacted with aggressive monetary tightening, rising its policy rates by 525 bps in 17 months. However, dealing supply shocks (and by extension, supply-driven inflation) with conventional monetary tightening was widely deemed to be ineffectual. Indeed, can rising policy rates solve supply chain constraints caused by the Russia-Ukraine conflict or industrial lockdowns in China during the pandemic days? Surely not.
Historically, the interest expense ratio exhibits a broad inverse relationship with the profit margins of US companies:
- In the 1999-2000 hiking cycle, interest expense ratio peaked at 36.1% in Dec 2001 while US profit margin troughed at 6.10%
- In the subsequent 2004-06 rate hiking cycle, interest expense ratio peaked at 29.5% in Jun 2009 while profit margin hit a trough at 6.67%
But the reverse is happening post-Subprime crisis. US companies seized on the opportunity to refinance their liabilities to long-term fixed debt at low interest rates as central banks around the world slashed policy rates to zero-bound. This explains why interest expense ratio has hit a low of 6.8% (vs long-term average of 22.3%) despite elevated bond yields.
The low interest expense ratio has, in turn, translated to higher profit margin for US companies. The latter currently stands at 12.36% (vs long-term average of 8.63%) and this underpins the resilience of corporate earnings.


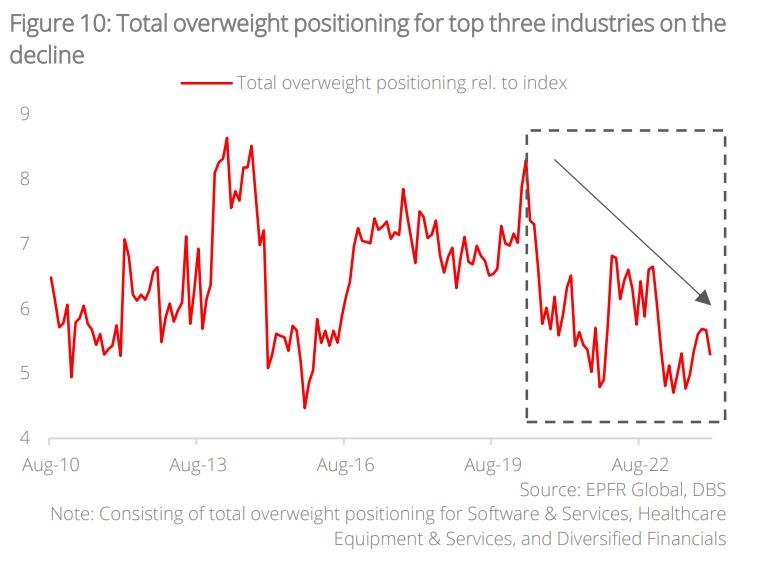
Investors’ portfolio positioning indicates room for rebalancing. Despite news headlines drumming up the overconcentration of major tech stocks in the current rally, industry allocation data from EPFR Global suggests otherwise.
Currently, the industries with the highest overweight positioning are Software Services (+2.6 %pts), Healthcare Equipment & Services (+1.6 %pts), and Diversified Financials (+1.1 %pts). At the other end of the spectrum, industries with the highest underweight positioning are Energy (-1.5 %pts), Technology Hardware & Equipment (-1.1 %pts), and Capital Goods (-1.0 %pts).
On an aggregated basis, the top three industries are 5.3 %pts overweight relative to benchmark while the bottom three industries are 3.6 %pts underweight. But instead of looking at these datapoints in isolation, we take a step back and observe how aggregate positionings have been trending since 2010. Here are the findings:
- “Overweight” Basket: The overweight positioning from this basket has actually been trending south since 2020, from +8.3 %pts to +5.3 %pts currently. The industries which saw a significant reduction in their overweight positioning are Software Services (-3.2 %pts) and Healthcare Equipment & Services (-0.6 %pts).
- “Underweight” Basket: The underweight positioning in this basket has worsened over time, down from a positive reading of +0.1 %pts in Dec 2018 to -3.6 %pts currently. On a segmental basis, all three industries registered declines during this period: Energy (-2.0 %pts), Technology Hardware & Equipment (-0.9 %pts), and Capital Goods (-0.8 %pts).
Based on the above data, we can infer that:
- Despite Software Services having the largest overweight positioning, the sector has actually been trending south since 2020. This suggests the level of “exuberance” in select tech-related plays is not as extreme as feared, reducing the risk of acute portfolio drawdowns in this segment.
- Investors’ positioning for the “Underweight” basket has, however, hit an extreme as the current level is similar to the ones registered back in 2015. This increases the likelihood of funds rotating to these segments (in particular the energy space) and broadening the rally.


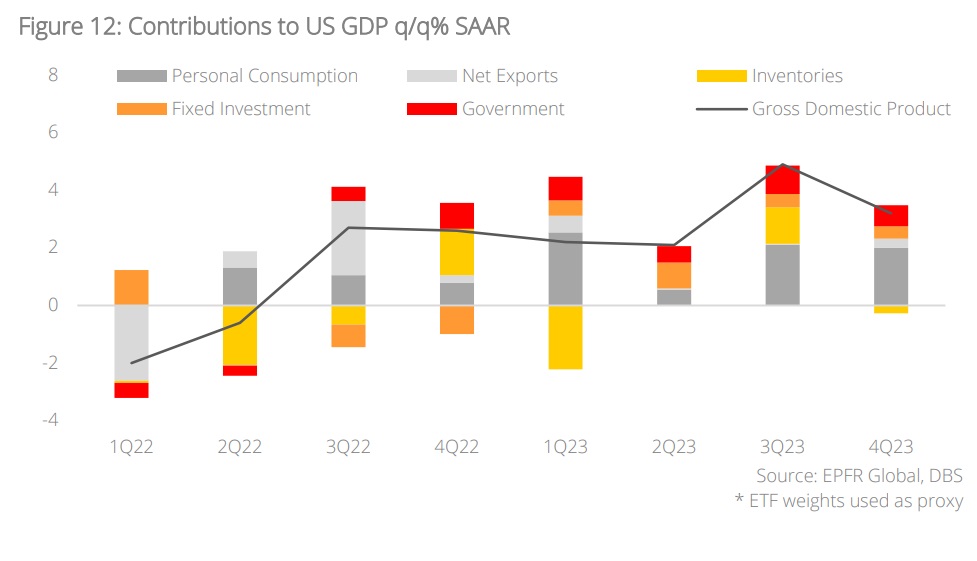
US economic resilience underpinned by robust consumption. The stubbornly resilient US economy has caught economists by surprise. Basic Economics 101 tells us that a high interest rate environment will be negative for consumption, investments, and overall economic activities. But judging from recent economic readings, this is certainly not the case. US GDP grew 3.3% q/q (annualised basis) in 4Q23, vastly exceeding the consensus forecast of 2.0% growth. The same happened in 3Q last year, with GDP growth of 4.9% exceeding market expectations of a 4.5% increase.
A breakdown of the GDP data shows that the key component underpinning US economic growth is domestic consumption. Indeed, personal consumption has been the single largest contributor of GDP in the past two quarters, accounting for 43% of growth in 3Q and 63% in 4Q. The robust consumer spending is, in turn, attributed to: (1) healthy jobs market and wage growth, (2) overall gains in assets prices leading to wealth effects, and (3) post-pandemic excess savings.
With the exception of post-pandemic excess savings (which will be depleted at some point), we believe that the first two drivers will stay in place to support domestic consumption and by extension, the broader economy. This supports our base-case assumption of a “soft landing” for the US economy.

Cross Assets – Marginal preference for bonds over equities. The latest scoring on our CAA framework suggests a marginal preference for bonds over equities.
Fundamentals: It is clear from incoming US economic data that high interest rates and the removal of pandemic-era support have failed to impact US domestic consumption as the latter remains buoyed by a robust jobs market. Consumer and business sentiments are on an upswing and should the strong macro momentum persist, upside to our 2024 US GDP forecast is plausible.
In contrast, the picture in Europe is drastically different. Despite avoiding a technical recession late last year, the Eurozone economy has largely stagnated in recent quarters with particular weakness evident in Germany and France. In Japan, our GDP forecast saw downward revision as a result of moderating domestic consumption and export demand.
Valuation: The gap between US earnings yield and US 10Y Treasury yield stood at -0.0354% in 1Q24 (as of 5 Mar) and this underlines the relative attractiveness of bonds over equities at this juncture.
Momentum: Fund flows data from EPFR Global suggests broad-based preference for bonds on a cross asset class basis. In 2023, bond funds saw inflows of USD280.8bn and this superseded the USD172.2bn that entered equities. This year, we are seeing a continuation of the same trend with USD98.9bn flowing to bonds (as of 21 Feb), as compared to USD74.0bn for equities.


Equities: Asia ex-Japan equities roaring back to life; Maintain overweight view. As the saying goes “Every dog has its day”. This is certainly indeed the case for AxJ equities as the beleaguered market is starting to show signs of life after enduring a dreaded 2023 which saw the region underperforming global equities by 16.5 %pts. Since the beginning of February, AxJ equities led the rally with 8.2% gains, outperforming global equities by 2.3 %pts along the way (as of 18 Mar). The rebound in AxJ equities is led by China (+11.4%) as result of the following factors:
- Rising expectations of policy support: The PBOC has in its quarterly policy implementation report stated that it will maintain policy flexibility to support domestic consumption while also ensuring price stability. Separately, China’s Vice Finance Minister Wang Dongwei has also said that the government will implement proactive fiscal policies to drive economic growth.
Taken together, it is evident that the government is determined to sustain China’s growth momentum via robust policy support and this augurs well for the outlook of domestic risk assets. - Attractive valuation support: At 10.8x forward P/E, China currently trades at 40.0% discount to global equities. While what’s cheap can remain cheap, the low valuation does suggest that a lot of downside has been priced-in and the bar set for an imminent rally is low.
- Extreme underweight portfolio positioning: Based on EPFR Global data, global portfolio allocators are 0.83 %pts underweight on China (43% below benchmark) and this is close to the all-time low. The light portfolio positioning suggests that investors’ expectations are low and this increases the probability of a substantial rebound when catalysts (especially policy clarity) return.


Bonds: Attractive risk-reward relative to equities; Maintain preference for IG credit in 3-5Y segment. The recent bout of disinflation has taken a pause as US inflation numbers came in above market expectations in December and January. Adding further fuel to bond yields is weaker-than-expected demand for US Treasury’s debt issuance to fund the government’s outsized fiscal needs. With the UST 10Y yield back to 4.3%, the combination of resurgent bond yields and rising equity valuations reinforces our preference for bonds from a cross-asset perspective.
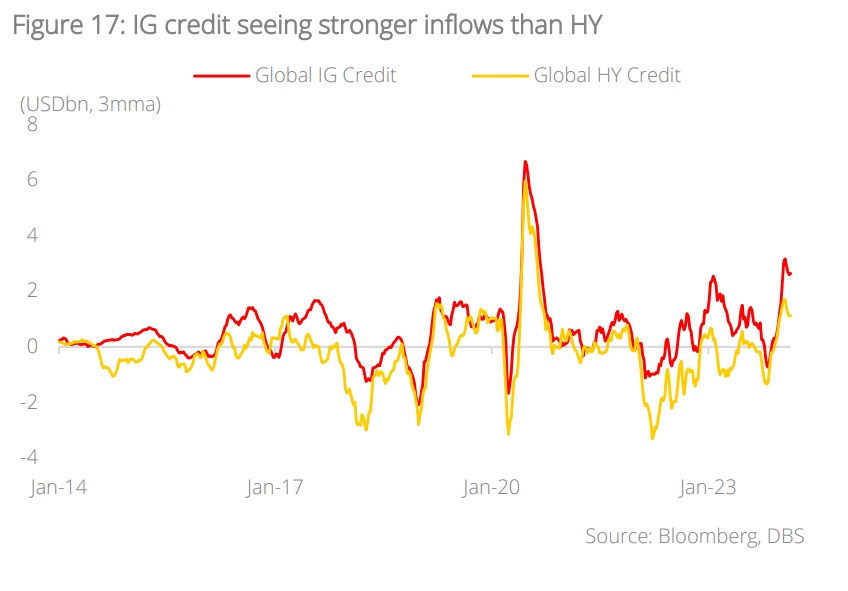
In the corporate credit space, we maintain our preference for IG credits and the 3-5Y duration bucket as the latter is best positioned to weather against market volatility should economic conditions deteriorate down the road. We see attractive risk-reward here. Our cautious view on HY bonds stays and this is reaffirmed by fund flows data. Since 2023, IG credit registered inflows of USD77.6bn and this far superseded inflows of USD4.6bn to HY credit.
Alternatives: Seek resilience in gold amid geopolitical uncertainties; Gain exposure to private assets for greater diversity in investment opportunities. We are living in uncertain times. The ongoing conflicts in Russia-Ukraine and the Middle East are showing no signs of ending. Adding to the proverbial wall of worries will be the US Presidential Election in which the outcome will have major bearing on global geopolitics. These are clear and present uncertainties that may derail risk assets over the course of the year. To protect portfolio downside, we believe a sizeable exposure to gold will be crucial in such an environment. This is particularly so if one subscribes to the view that bond yields have peaked and a Fed rate cut is matter of when, not if.
Investors’ interest and participation in the private assets space, meanwhile, continue to see robust growth and we advise portfolio allocators to gain exposure given:
- Wider spectrum of investments opportunities: For investors that are willing to sacrifice some degree of liquidity, private markets investing provides the former with access to opportunities (particularly those in emerging innovations) that remain underrepresented in public markets.
- Value creation via active management: The complexity involved in private assets transactions allows investors to identify opportunities in an opaque market and create value through active involvement in the operations of the underlying assets.
- Adoption of longer-term investment horizons: The illiquid nature of private assets encourages investors to adopt long-term investment views while reducing the natural human tendency of making impulsive investment decisions during periods of extreme market volatility.


Topic
The information published by DBS Bank Ltd. (company registration no.: 196800306E) (“DBS”) is for information only. It is based on information or opinions obtained from sources believed to be reliable (but which have not been independently verified by DBS, its related companies and affiliates (“DBS Group”)) and to the maximum extent permitted by law, DBS Group does not make any representation or warranty (express or implied) as to its accuracy, completeness, timeliness or correctness for any particular purpose. Opinions and estimates are subject to change without notice. The publication and distribution of the information does not constitute nor does it imply any form of endorsement by DBS Group of any person, entity, services or products described or appearing in the information. Any past performance, projection, forecast or simulation of results is not necessarily indicative of the future or likely performance of any investment or securities. Foreign exchange transactions involve risks. You should note that fluctuations in foreign exchange rates may result in losses. You may wish to seek your own independent financial, tax, or legal advice or make such independent investigations as you consider necessary or appropriate.
The information published is not and does not constitute or form part of any offer, recommendation, invitation or solicitation to subscribe to or to enter into any transaction; nor is it calculated to invite, nor does it permit the making of offers to the public to subscribe to or enter into any transaction in any jurisdiction or country in which such offer, recommendation, invitation or solicitation is not authorised or to any person to whom it is unlawful to make such offer, recommendation, invitation or solicitation or where such offer, recommendation, invitation or solicitation would be contrary to law or regulation or which would subject DBS Group to any registration requirement within such jurisdiction or country, and should not be viewed as such. Without prejudice to the generality of the foregoing, the information, services or products described or appearing in the information are not specifically intended for or specifically targeted at the public in any specific jurisdiction.
The information is the property of DBS and is protected by applicable intellectual property laws. No reproduction, transmission, sale, distribution, publication, broadcast, circulation, modification, dissemination, or commercial exploitation such information in any manner (including electronic, print or other media now known or hereafter developed) is permitted.
DBS Group and its respective directors, officers and/or employees may have positions or other interests in, and may effect transactions in securities mentioned and may also perform or seek to perform broking, investment banking and other banking or financial services to any persons or entities mentioned.
To the maximum extent permitted by law, DBS Group accepts no liability for any losses or damages (including direct, special, indirect, consequential, incidental or loss of profits) of any kind arising from or in connection with any reliance and/or use of the information (including any error, omission or misstatement, negligent or otherwise) or further communication, even if DBS Group has been advised of the possibility thereof.
The information is not intended for distribution to, or use by, any person or entity in any jurisdiction or country where such distribution or use would be contrary to law or regulation. The information is distributed (a) in Singapore, by DBS Bank Ltd.; (b) in China, by DBS Bank (China) Ltd; (c) in Hong Kong, by DBS Bank (Hong Kong) Limited; (d) in Taiwan, by DBS Bank (Taiwan) Ltd; (e) in Indonesia, by PT DBS Indonesia; and (f) in India, by DBS Bank Ltd, Mumbai Branch.
Related insights_tr
- Macro Insights Livestream: Thursday May 9th - 4pm SGT 03 May 2024
- Singapore Equity Picks02 May 2024
- Global Sports Apparel: Reposition against Rising Players02 May 2024
Related insights_tr
- Macro Insights Livestream: Thursday May 9th - 4pm SGT 03 May 2024
- Singapore Equity Picks02 May 2024
- Global Sports Apparel: Reposition against Rising Players02 May 2024