

- Comparisons between Big Tech and Dot-com Tech largely unjustified
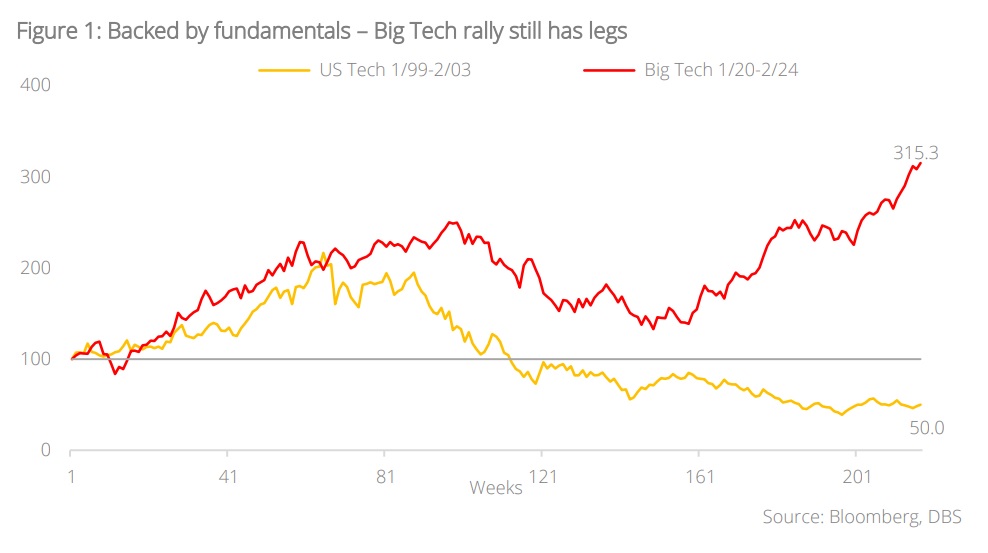
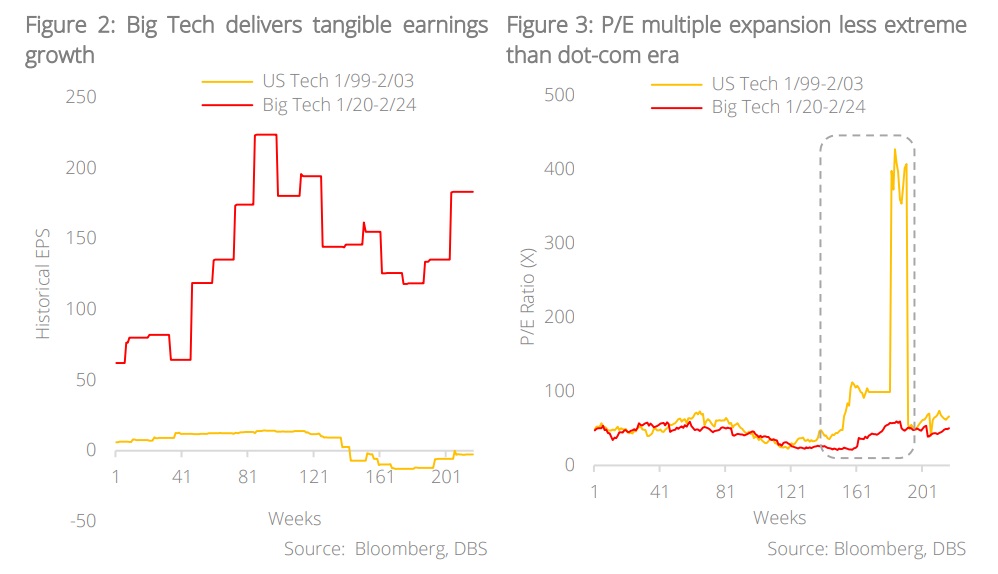
- Unlike their predecessors, Big Tech has solid earnings growth to support rallying prices – multiples were nowhere near as high as during the dot-com bubble
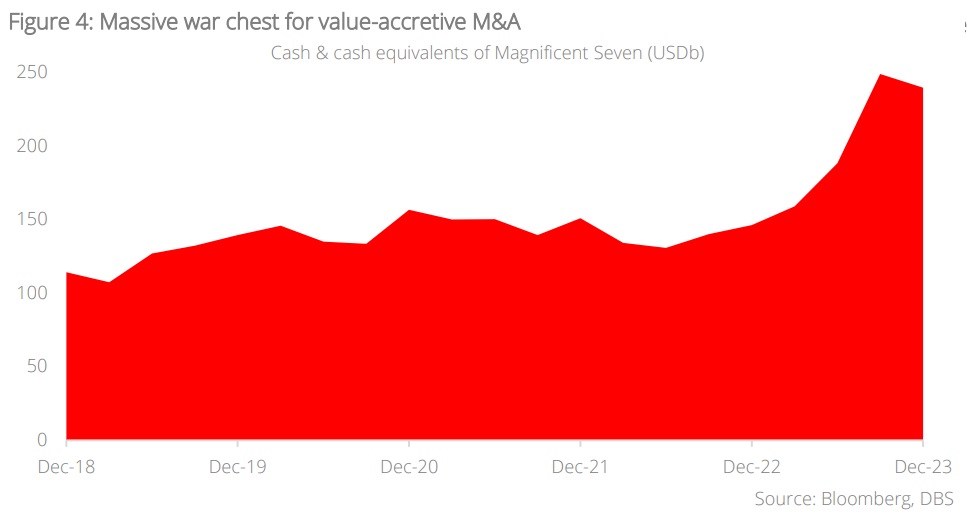
- Tech sector leaders today have solid balance sheets and financial muscle to engage in value-accretive M&A
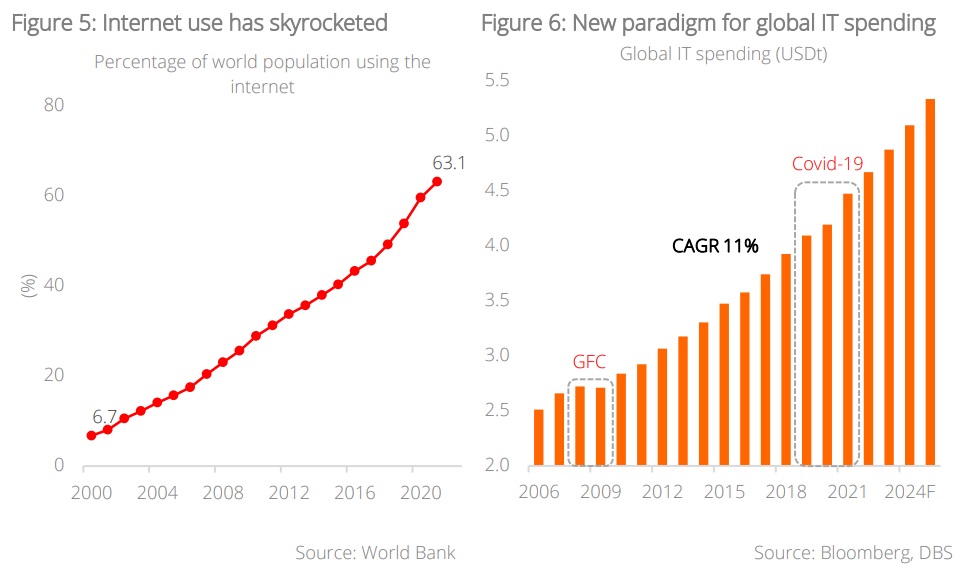
- The world has vastly changed since 2000 and now revolves around technology
- Anchor with DBS CIO I.D.E.A to ride the wave of Big Tech and other key areas of quality growth

Related insights

Comparisons aplenty, but not all are fair. Given the stellar rally of Big Tech and technology stocks over the past year, it was inevitable that parallels would be drawn to the dot-com bubble of 2000. In fact, market observers have gone as far as comparing Nvidia to the dot-com era Cisco, citing similarities in the steep run-up in prices as well as their poster child status within the tech space. While such comparisons are understandable – the price momentum and sectors involved in today’s tech rally do bear some resemblance to dot-com – we believe that they should be taken more as food for thought than a direct cautionary tale. This is because, barring some of the superficial similarities highlighted above, the world and the technology sector today is vastly different from what it was during the dot-com bubble.
Not an asset bubble in the making. While the dot-com crash was a painful event for many investors, it served an important function of trimming the fat in the US stock market. After the bubble burst in 2000, many companies that sought to ride the novelty of the dot-com concept wound up after burning through their funding and failing to become profitable. What remained were companies that had solid fundamentals, many of which became highly profitable and successful. Many of these surviving names have now become part of today’s Magnificent Seven. And the important thing to note about these companies is that, unlike their dot-com era predecessors, their share price performance is backed up by sound fundamentals.
Performance backed by strong earnings. The Magnificent Seven and other tech sector leaders have been delivering EPS growth that far exceeds that of the dot-com era companies, and as a result we are seeing less extreme multiple expansion even though prices have run up significantly. The disjoint between share price performance and underlying earnings that we saw during the dot-com bubble is simply not there with the Big Tech companies of today.
More money, less problems. Another key difference is that majority of Big Tech companies today have a much stronger capital position than their dot-com era counterparts; they have grown much larger, but at the same time are more lowly-geared, and have significantly higher cash balances. In addition to added financial resilience and stability, large cash piles have also been bestowed upon Big Tech, with the ability to partake in opportunistic M&A to further grow their earnings ability and deepen their innovation moat. As at Dec 2023, the collective cash balance of the Magnificent Seven stood at a massive USD240b. To put things into perspective, this amount is roughly equivalent to the size of New Zealand’s GDP or four times the cash acquisition value of Activision Blizzard paid by Microsoft (USD61b). The robust balance sheet of modern-day Big Tech companies is yet another reason why we will likely not see a dot-com redux.
Post dot-com, Tech runs the world. There is little doubt that technology companies have come a long way since the dot-com bubble, and just as evident is how different the world is today compared to the early 2000s; the advent of the smartphone, the rise of social media, and the overall digital transformation undertaken by society has completely changed the way people live, work and play. Based on World Bank estimates, the percentage of the global population using the internet back in 2000 was a mere 6.7%. However, fast-forward to 2021, that number has jumped almost tenfold to 63.1%. This has facilitated the greatest secular trend of our generation: the world becoming a digital economy. Riding on this trend, the technology sector has found waves of further monetisation opportunities, which has in turn solidified their profitability. It has also ushered in a new paradigm for global IT spending; the direct total addressable market (TAM) for technology is expected to grow to USD5.3t by 2025. The indirect benefits, however, will likely far exceed this amount as growth in the technology space will have profound impact to a wide range of industries and firms operating across the globe. Simply put, technology makes up a far greater proportion of global GDP than it did in 2000, and that can only be beneficial for Big Tech and technology companies in general.
Anchor with DBS CIO I.D.E.A for quality growth. Having established that the current technology rally is not a bubble, we advocate for investors to continue staying engaged with the markets and having meaningful portfolio exposure to Big Tech names for their quality growth characteristics. We cover in greater detail, the value proposition of investing in Big Tech in an earlier CIO Perspectives titled “Global Big Tech – Quality GARP”. Beyond Big Tech, look to also add quality growth names from other sectors like luxury and healthcare, as well as thematic areas of focus such as the energy transition using the DBS CIO I.D.E.A (Innovators, Disruptors, Enablers, and Adapters) framework.
Topic
The information published by DBS Bank Ltd. (company registration no.: 196800306E) (“DBS”) is for information only. It is based on information or opinions obtained from sources believed to be reliable (but which have not been independently verified by DBS, its related companies and affiliates (“DBS Group”)) and to the maximum extent permitted by law, DBS Group does not make any representation or warranty (express or implied) as to its accuracy, completeness, timeliness or correctness for any particular purpose. Opinions and estimates are subject to change without notice. The publication and distribution of the information does not constitute nor does it imply any form of endorsement by DBS Group of any person, entity, services or products described or appearing in the information. Any past performance, projection, forecast or simulation of results is not necessarily indicative of the future or likely performance of any investment or securities. Foreign exchange transactions involve risks. You should note that fluctuations in foreign exchange rates may result in losses. You may wish to seek your own independent financial, tax, or legal advice or make such independent investigations as you consider necessary or appropriate.
The information published is not and does not constitute or form part of any offer, recommendation, invitation or solicitation to subscribe to or to enter into any transaction; nor is it calculated to invite, nor does it permit the making of offers to the public to subscribe to or enter into any transaction in any jurisdiction or country in which such offer, recommendation, invitation or solicitation is not authorised or to any person to whom it is unlawful to make such offer, recommendation, invitation or solicitation or where such offer, recommendation, invitation or solicitation would be contrary to law or regulation or which would subject DBS Group to any registration requirement within such jurisdiction or country, and should not be viewed as such. Without prejudice to the generality of the foregoing, the information, services or products described or appearing in the information are not specifically intended for or specifically targeted at the public in any specific jurisdiction.
The information is the property of DBS and is protected by applicable intellectual property laws. No reproduction, transmission, sale, distribution, publication, broadcast, circulation, modification, dissemination, or commercial exploitation such information in any manner (including electronic, print or other media now known or hereafter developed) is permitted.
DBS Group and its respective directors, officers and/or employees may have positions or other interests in, and may effect transactions in securities mentioned and may also perform or seek to perform broking, investment banking and other banking or financial services to any persons or entities mentioned.
To the maximum extent permitted by law, DBS Group accepts no liability for any losses or damages (including direct, special, indirect, consequential, incidental or loss of profits) of any kind arising from or in connection with any reliance and/or use of the information (including any error, omission or misstatement, negligent or otherwise) or further communication, even if DBS Group has been advised of the possibility thereof.
The information is not intended for distribution to, or use by, any person or entity in any jurisdiction or country where such distribution or use would be contrary to law or regulation. The information is distributed (a) in Singapore, by DBS Bank Ltd.; (b) in China, by DBS Bank (China) Ltd; (c) in Hong Kong, by DBS Bank (Hong Kong) Limited; (d) in Taiwan, by DBS Bank (Taiwan) Ltd; (e) in Indonesia, by PT DBS Indonesia; and (f) in India, by DBS Bank Ltd, Mumbai Branch.