

- Equities on the retreat amid rising bond yields; little differentiation in regional performance expected
- Rising preference for bonds overincome equities; since Aug 2022, blended yield for bonds has superseded dividend yield of income equities
- Quality plays to outperform; as cost of capital rises, companies with strong fundamentals to withstand challenging environment preferred
- De-risking in China-related exposure gathers steam; await further monetary/fiscal stimulus and clarity on government policies
- For Alternatives, seek opportunities in PE secondaries and private credit, gain exposure to gold as portfolio riskdiversifier

Related insights

The recession that never was. The late economist John Maynard Keynes famously said, “When the facts change, I change my mind”. These words resonate with investors navigating the ebbs and flows of global financial markets today.
Since mid-2022, the street has been calling for the imminence of a US recession “within 12 months”. The train of thought was simple: High inflation, coupled with rising interest rates, will hit domestic consumption and throw the economy into a tailspin. This assumption was reinforced by the fact that the US Treasury yield curve – historically a harbinger of impending recession – had undergone inversion.
But a year has passed. And the much talked-about recession is still nowhere in sight. We attribute this phenomenon to a confluence of factors happening on the American corporate and households front. On the corporate side of the equation, US earnings have remained strangely resilient despite rising bond yields and this could be attributed to:
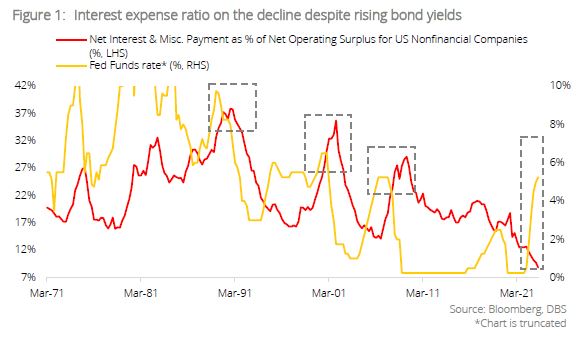
- Sharp reduction in interest expense: Based on conventional thinking, companies’interest expense will increase as policy rates rise and historically, this has been thecase:
- In Mar-1989, the Fed Funds rate peaked at 9.75% and interest payments (plusmiscellaneous) as percentage of net operating surplus for US non-financialcompanies peaked at 37.9% in subsequent six quarters.
- In Jun-2000, the Fed Funds rate peaked at 6.5% and the interest expense ratiohit a high of 35.7% in subsequent six quarters.
- More recently in Jun-2006, we saw the Fed Funds rate peaking at 5.25% andthe interest expense ratio plateaued at 29.1% in subsequent 12 quarters.
But post-Subprime crisis, the reverse happened. As central banks around the world slashed policy rates to the zero bound, US companies seized the opportunity to refinance their liabilities to long-term fixed debt at low interest rates. This explains why, despite the Fed fund rate hitting 5.25% in this monetary tightening cycle, the interest expense ratio has fallen to a low of 8.9% (vs. long-term average of 22.1%). Low interest expense allows US companies to maintain their corporate profitability despite macro headwinds.
- Prevalence of “Greedflation”: The phenomenon of “Greedflation”, a point which we highlighted last quarter, refers to companies taking advantage of rising inflation to mark up their average selling prices far higher than the increase in input cost. This underpins why US profit margins have managed to stay elevated despite tightening monetary condition. Lael Brainard (the previous Vice Chair of US Federal Reserve) previously highlighted the prevalence of this trend during the start of the year.
On the households front, US domestic consumption has similarly remained resilient and this is due to:
- Pandemics excess savings: US household savings grew at an unprecedented rate during the pandemic amid strong fiscal response from the federal government and weakness in consumer spending (given economic closures and social distancing). While these savings have undergone rapid drawdowns since, the Fed estimates that c.USD500b worth of excess savings still exist in the economy and underpin domestic consumption.
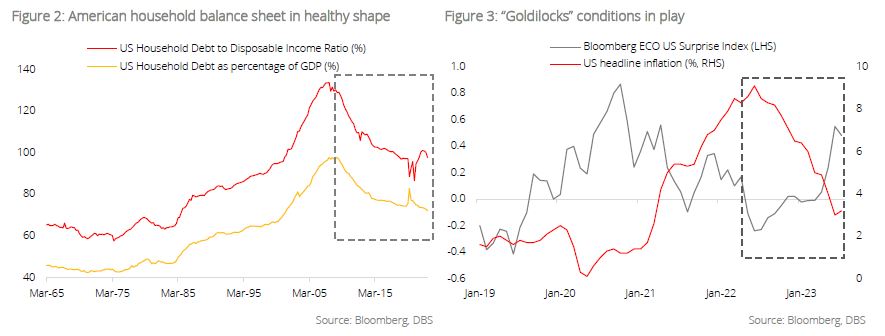
- Low household debt: US household debt to disposable income has remained near historical lows as it retraced from the high of 133.72% in 1Q08 to 97.68% in 1Q23. This suggests American household balance sheets remain healthy and are less impacted by rising rates given the absence of excessive gearing during the boom years.
- Resilient labour market: A commonly held assumption is for the US labour market to deteriorate as rising rates weigh on economic activities. The reverse, however, is happening. Despite aggressive Fed tightening, US unemployment remains near historical lows while salary gains are at historical highs, averaging at 4.8% since 2020.
Factors underpinning US labour market strength include (a) strong fiscal response to the Covid- 19 pandemic and (b) phenomenon of dislocated workers securing salary increments upon their return to the workforce given widespread labour shortages.
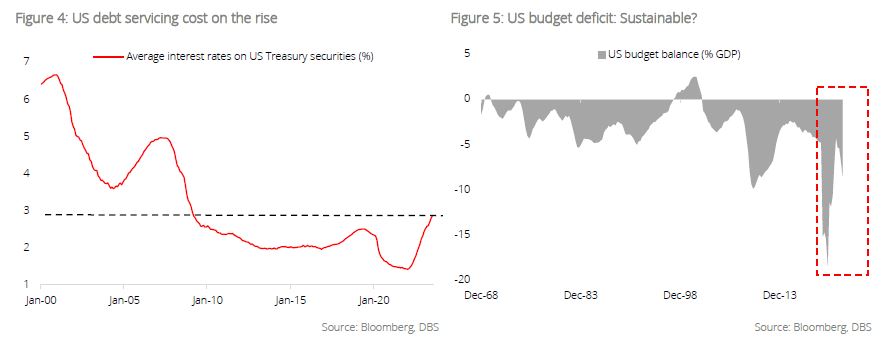
Time for a recalibration of base-case assumptions. Clearly, the street has vastly misinterpreted the strength and underlying resilience of the US economy. Given the prevalence of “Goldilocks” conditions (characterised by moderating inflation and firm economic momentum), the likelihood of a “soft landing” for the US economy is on the rise.
But the fight against inflation is far from over. While inflationary pressure has softened globally, central bankers are now facing the dilemma of navigating between further tightening or putting rates on hold as they await the effects from previous rate hikes.
Rate hikes, meanwhile, are admittedly a blunt and inappropriate instrument to solve today’s inflation challenges. The stubbornly high inflation stemmed not from overheating demand but from global supply chain shocks arising from the Covid-19 pandemic and ongoing Russia-Ukraine crisis. Solving supply shocks is never going to be easy.
In the coming quarter, the shifting macro and geopolitical landscape warrants a recalibration of our base case assumptions and we believe that the following themes will dominate in 4Q23:
- Re-emergence of “Higher for Longer”
- End of an era: Preference for bonds over income equities
- China: In dire need of policy clarity
Resurgent bond yields and implications for risk assets. Inflation-adjusted bond yields are rising. From the lows of 1.06% on 6 April, the Treasury Inflation-Protected Securities (TIPS) 10Y yield has surged to 1.922% (as of 13 Sep) due to:
- US economic resilience: US economic data has been surprising on the upside and this is evident from the broad up-move in the Citi Economic Surprise Index this year. Retail sales, ISM Services, and strong employment numbers all suggest that US consumers can withstand the pressure from rising inflation and interest rates. In fact, the Atlanta Fed is currently projecting GDP growth of 5.571% (vs. 1.942% back in 3 July) as the recovery gathers.
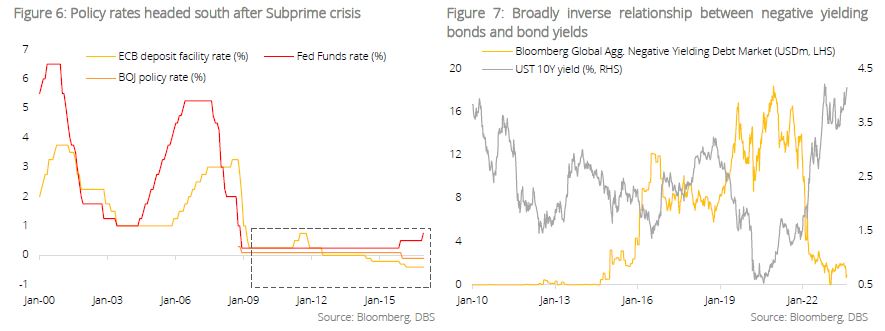
- Rising Treasury issuance: Treasury issuance is on the rise. Based on projections from the US Department of Treasury, the auction size for the 2Y note is expected to be at USD51b in October (vs. USD42b in March) while issuance of the 5Y note is slated to be at USD52b (vs. USD43b in May). The increase in auction sizes is driven by two factors: (a) rising Treasury debt servicing cost in the US as the average interest rate for Treasury securities hit 2.873% in July (highest level since Feb-2009) and (b) the need to bridge the gap between tax revenue and government spending.
- BOJ loosening of YCC: The BOJ has taken steps to loosen its YCC policy by allowing the 10Y JGB yield to fluctuate within a 1% band (as opposed to 0.5%). A resilient Japanese economy, coupled with rising price pressure and lingering yen weakness, are likely to prompt the BOJ to further tighten monetary policy. For years, Japanese investors have been one of the biggest buyers of foreign bonds in the global search for yield. But as bond yields in Japan head higher, these investors will increasingly switch out of foreign markets to seek opportunities at home, and this will inevitably put upward pressure on global bond yields.
End of an era: Preference for bonds over income equities
The global “search for yield” – A recap.Since the Global Financial Crisis in 2008, the Fed adopted a “zero interest rate” policy by cutting rates close to the zero bound – a similar move previously adopted by the BOJ. This, followed by years of quantitative easing, kept long-term Treasury yields anchored to the lows.
In the decade that followed, a common portfolio strategy adopted by investors was the global “search for yield”. To support economic activities and attain overall price stability, the ECB and BOJ introduced a “negative interest rate” policy (in 2014 and 2016 respectively), setting the stage for a global deluge of negative yielding government bonds in subsequent years.
Yield scarcity drove portfolio allocators to income equities.Global bond yields languished in the doldrums after the Global Financial Crisis. And despite a brief reprieve during 2017-2018, yields resumed their downward spiral when Covid-19 pandemic struck. To rescue fledging economies hard hit by the crisis, central banks took out their usual playbook and slashed policy rates again.
The scarcity in yield compelled portfolio allocators to divert their exposure from government bonds to corporate credit and beyond:
- From 2001-2010, the average yield for US 10Y Treasuries was 4.1%. However, aggressive monetary easing and overall economic instability drove the average yield to 2.1% from 2011-2021 (a decline of 200 bps).
- To enhance portfolio yield, investors diverted their exposure from government bonds to corporate credit. An equal-weighted portfolio consisting of government and corporate bonds garnered an average yield of 2.6% from 2011-2021.
- To further enhance portfolio yield, investors switched their allocation to income equities. An equal-weighted portfolio consisting of government bonds, corporate bonds, and income equities garnered an average yield of 3.1% from 2011-2021.
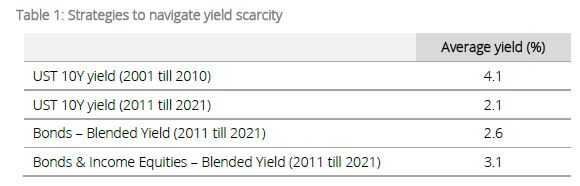
The third strategy of combining bonds and income equities was widely adopted during years where yield was in extreme scarcity.
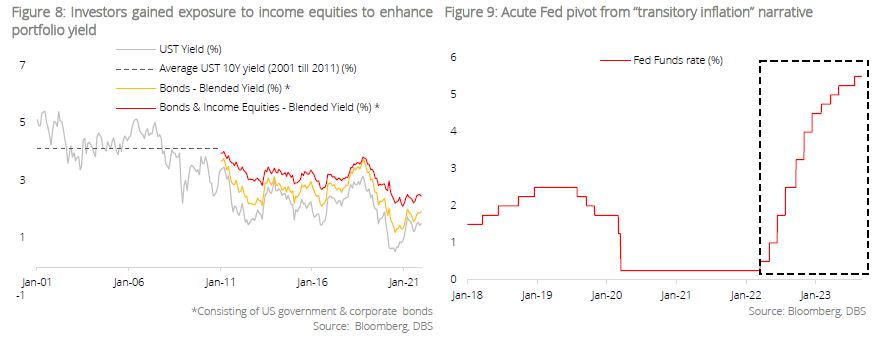
Changing Lanes – Rising preference for bonds over income equities. The post-pandemic inflation surge as a result of the Russia-Ukraine crisis and supply chain disruption took central bankers by surprise. US headline inflation rose and hit a peak of 9.1% in Jun 2021 (the highest since the early- 80s), compelling the Fed to pivot from its “transitory inflation” narrative to hawkish monetary tightening.
Now, with bond yields expected to stay “higher for longer”, a recalibration of the “search for yield” portfolio strategy is necessary.
Since Aug 2022, the blended yield for bonds (consisting of Treasuries and corporate bonds) has superseded the dividend yield for income equities. This suggests that the addition of income equities no longer boosts the overall yield of a portfolio. And therefore from a yield perspective, we prefer bonds over income equities at this part of the market cycle.
China: In dire need of stimulus and policy clarity
“Japanification”: The Chinese great wall of worries. Back in January, confidence on China’s outlook was sky high. But the mood has soured quickly as the market was subsequently dealt a one-two punch. The first was the weaker-than- expected post-pandemic economic reopening. Indeed, initial hopes of strong pent-up demand spurring domestic consumption failed to transpire as Chinese consumers stayed on the sidelines even after the end of the Covid-zero policy.
The fiasco surrounding Country Garden rekindled systemic concerns on the real estate sector (which accounts for roughly one quarter of China’s economy) and the shadow banking space. More crucially, it also put the spotlight on China’s “Japanification” moment as conversations surrounding structural imbalances in the Middle Kingdom took hold. Hopes of massive policy stimulus coming to the rescue, meanwhile, remained elusive. While the PBOC has cut lending rates, these policy measures are not substantial enough to give the economy a massive boost.
Investors are not standing still in the face of these headwinds. De-risking in China-related exposure is gathering steam; since August, a DM index consisting of companies with substantial China exposure has underperformed the broader market by 4.3 %pts (as of 29 Aug). We believe such weakness will persist until substantial monetary/fiscal stimulus and further clarity on government policies are evident.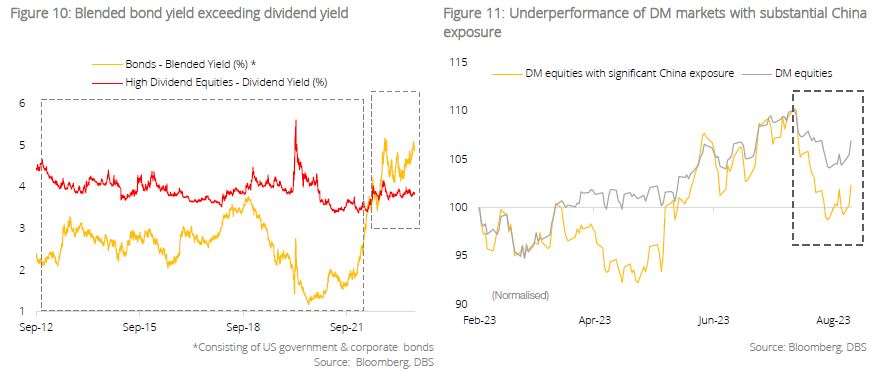
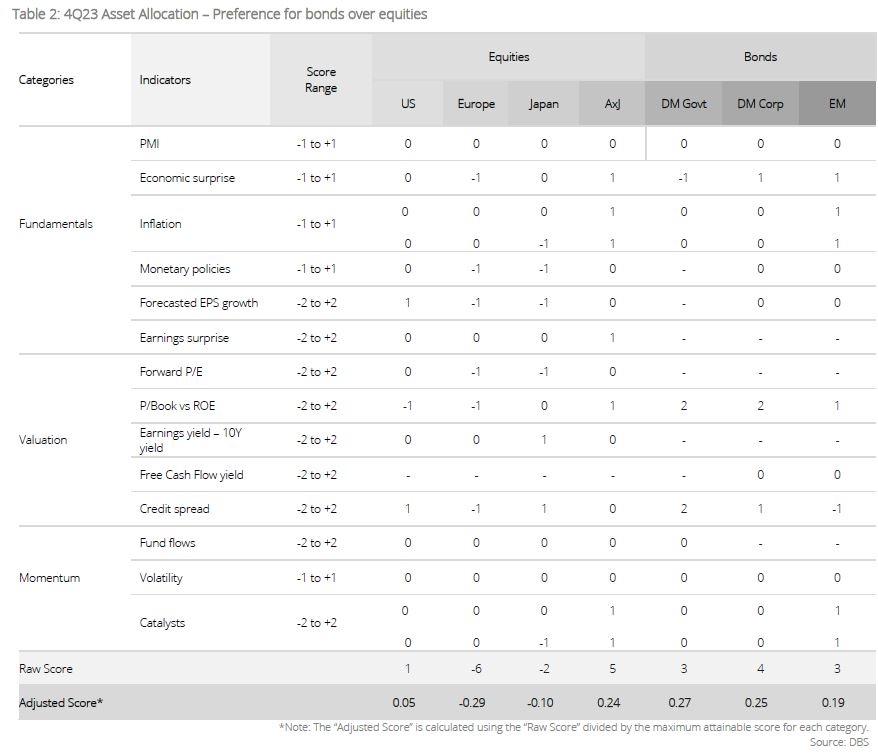
Cross Assets – Marginal preference for bonds over equities. The latest scoring on our CAA framework suggests that our view on both equities and bonds is broadly Neutral in 4Q, with a slight preference for bonds over equities (in particular dividend stocks).
Fundamentals: The US economy has remained broadly resilient despite tightening financial conditions and this is evident from economic indicators like retail sales and investments. Corporate and household balance sheets are evidently robust enough to absorb the increase in the cost of capital. Inflation, meanwhile, is on an easing path and the likelihood of a sharp spike in inflationary pressure further down the road is low.
On corporate earnings, the proportion of companies reporting positive earnings surprise in the US has improved marginally from 78.5% to c.79.9% in the recent reporting season. That said, the percentage of companies reporting actual earnings growth remains underwhelming at 57.4% as corporate margins pressure persists. Sectors that registered low percentage of earnings growth include Energy (c.21.7%) and Materials (c.27.6%).
Valuation: The gap between US earnings yield and US 10Y Treasury yield has contracted further to 0.324% in 3Q23 (as of 13 Sep) as bond yields continued their upward march during the quarter. Bonds are looking marginally more attractive than equities at this juncture.
Momentum: Inflows into global bonds remained healthy at USD50.9b during the quarter (as of 23 Aug), bringing total flows to USD230.3b YTD. Equities registered inflows of USD36.2b as well and this accounted for close to half of total net inflows for the year.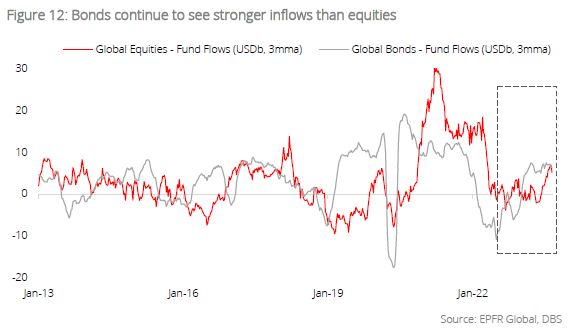
Equities: Equities on the retreat amid rising bond yields; little differentiation in regional performance expected. Global equities underwent a broad-based retreat in 3Q23 as resurgent bond yields triggered broad-based profit taking. Global equities was down 1.5% (as of 25 Aug) and no region was spared from this selldown. In DM, Japan and Europe underperformed with respective losses of 3.1% and 3.0%. The US managed to outperform marginally with a 0.8% decline, buoyed by strong performance in the energy space.
With bond yields staying “higher for longer”, we expect equity markets to stay subdued in 4Q23 with little differentiation in performance among the key regions. The huge run-up in 2Q23 was predominantly driven by expectations of peak Fed. But the rhetoric at Jackson Hole suggests that this is not the case and hence, the initial enthusiasm for interest-rate sensitive plays will see some tapering in the months ahead.
Within DM, we maintain a preference for US and Japan given stronger macro momentum in these markets. Europe, on the other hand, continues to face recession headwinds as high inflation is forcing households to cut back on consumption.
Our call on Asia ex-Japan continues to underwhelm given overall weakness in China equities. But given the sharp run-up in DM equities, China is looking attractive from a valuation perspective. The yield gap stands at 5.1% and this is 393 bps higher than DM. A strong dose of policy stimulus will rekindle the animal spirits for the market.
Quality plays to outperform as the going gets tough. Despite overall headwinds, there is one silver lining: The outperformance of quality plays. Using US equities as proxy, since August, US quality stocks have outperformed the broader market. This reinforces the view that as the cost of capital rises, companies with strong fundamentals to withstand the challenging environment are preferred among portfolio allocators.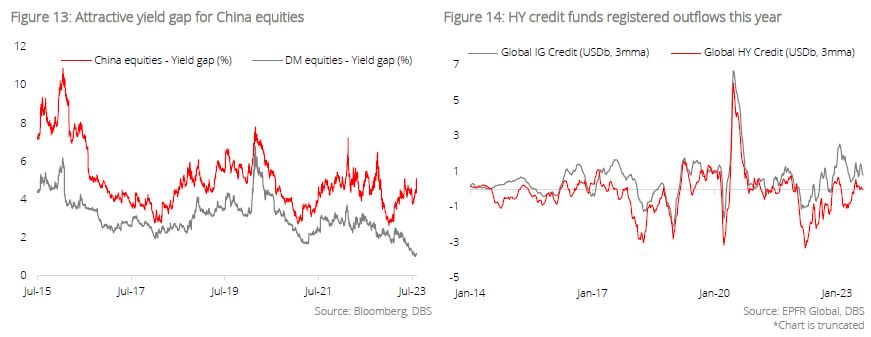
Bonds: Favour quality plays; sweet spot remains with A/BBB credit in 3-5Y duration bucket. The abundance of government bonds offering attractive real yields is crowding out private sector issuance. This inevitably compels corporate issuers to delay their issuance in the hope that the financing could be done at a more favourable interest rate in the future. In this deleveraging phase, investors should stick to IG credit with strong balance sheets that can tide them through periods of volatility and high interest rates. Sweet spot remains with A/BBB credit in the 3-5Y duration bucket.
Meanwhile, we maintain our cautious view on HY credit. The latter possesses substantially lower duration compared to IG and this translates to higher refinancing risks in the years ahead. We expect HY spreads to widen next year as default risks mount in a high interest rates environment. Fund flows data from EPFR Global reinforces our view. On a YTD basis, fund inflows into IG credit totalled USD41.2b (as of 23 Aug) while HY credit registered outflows of USD9.1b.
Alternatives: Seek opportunities in PE secondaries and private credit; gain exposure to gold as portfolio risk diversifier. Despite moderating company valuations and bleak exit prospects, we see opportunities in the private equity secondaries market space. The same can be said for private credit. While the latter faces competition from attractive bond yields in public markets, portfolios with exposure to opportunistic strategies will still provide diversification benefits as they allow investors to hedge against economic headwinds through dislocations and defaults.
On gold, we maintain our constructive view with a 12M target price of USD2,050/oz. The peaking of Fed monetary tightening cycle and potential rate cuts starting in 2H24 are tailwinds for the precious metal. Apart from ETFs, we also see rising demand from central banks as simmering geopolitical uncertainties fuel the de-dollarisation narrative. Gain exposure to gold as a portfolio risk diversifier given its low correlation with major asset classes, in particular, global equities.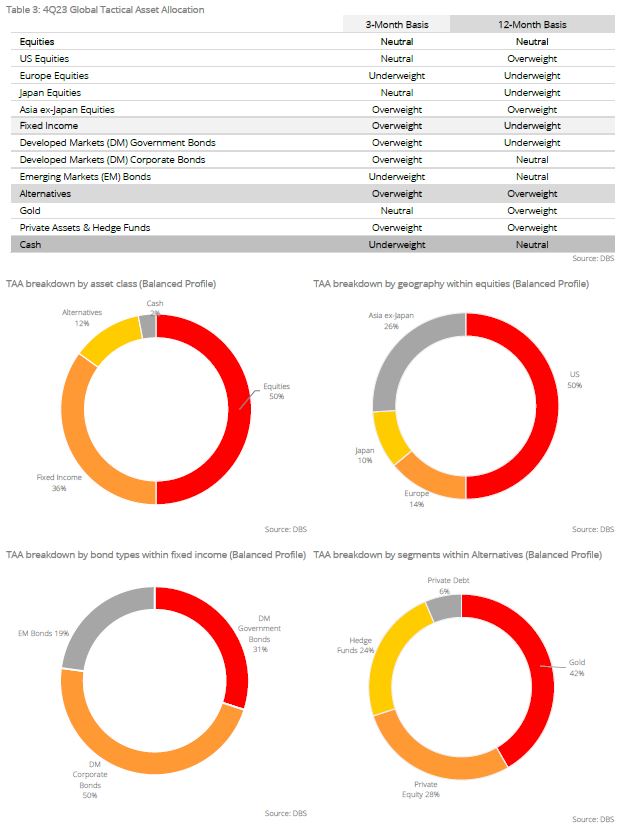
Topic
The information published by DBS Bank Ltd. (company registration no.: 196800306E) (“DBS”) is for information only. It is based on information or opinions obtained from sources believed to be reliable (but which have not been independently verified by DBS, its related companies and affiliates (“DBS Group”)) and to the maximum extent permitted by law, DBS Group does not make any representation or warranty (express or implied) as to its accuracy, completeness, timeliness or correctness for any particular purpose. Opinions and estimates are subject to change without notice. The publication and distribution of the information does not constitute nor does it imply any form of endorsement by DBS Group of any person, entity, services or products described or appearing in the information. Any past performance, projection, forecast or simulation of results is not necessarily indicative of the future or likely performance of any investment or securities. Foreign exchange transactions involve risks. You should note that fluctuations in foreign exchange rates may result in losses. You may wish to seek your own independent financial, tax, or legal advice or make such independent investigations as you consider necessary or appropriate.
The information published is not and does not constitute or form part of any offer, recommendation, invitation or solicitation to subscribe to or to enter into any transaction; nor is it calculated to invite, nor does it permit the making of offers to the public to subscribe to or enter into any transaction in any jurisdiction or country in which such offer, recommendation, invitation or solicitation is not authorised or to any person to whom it is unlawful to make such offer, recommendation, invitation or solicitation or where such offer, recommendation, invitation or solicitation would be contrary to law or regulation or which would subject DBS Group to any registration requirement within such jurisdiction or country, and should not be viewed as such. Without prejudice to the generality of the foregoing, the information, services or products described or appearing in the information are not specifically intended for or specifically targeted at the public in any specific jurisdiction.
The information is the property of DBS and is protected by applicable intellectual property laws. No reproduction, transmission, sale, distribution, publication, broadcast, circulation, modification, dissemination, or commercial exploitation such information in any manner (including electronic, print or other media now known or hereafter developed) is permitted.
DBS Group and its respective directors, officers and/or employees may have positions or other interests in, and may effect transactions in securities mentioned and may also perform or seek to perform broking, investment banking and other banking or financial services to any persons or entities mentioned.
To the maximum extent permitted by law, DBS Group accepts no liability for any losses or damages (including direct, special, indirect, consequential, incidental or loss of profits) of any kind arising from or in connection with any reliance and/or use of the information (including any error, omission or misstatement, negligent or otherwise) or further communication, even if DBS Group has been advised of the possibility thereof.
The information is not intended for distribution to, or use by, any person or entity in any jurisdiction or country where such distribution or use would be contrary to law or regulation. The information is distributed (a) in Singapore, by DBS Bank Ltd.; (b) in China, by DBS Bank (China) Ltd; (c) in Hong Kong, by DBS Bank (Hong Kong) Limited; (d) in Taiwan, by DBS Bank (Taiwan) Ltd; (e) in Indonesia, by PT DBS Indonesia; and (f) in India, by DBS Bank Ltd, Mumbai Branch.